
Bitcoin
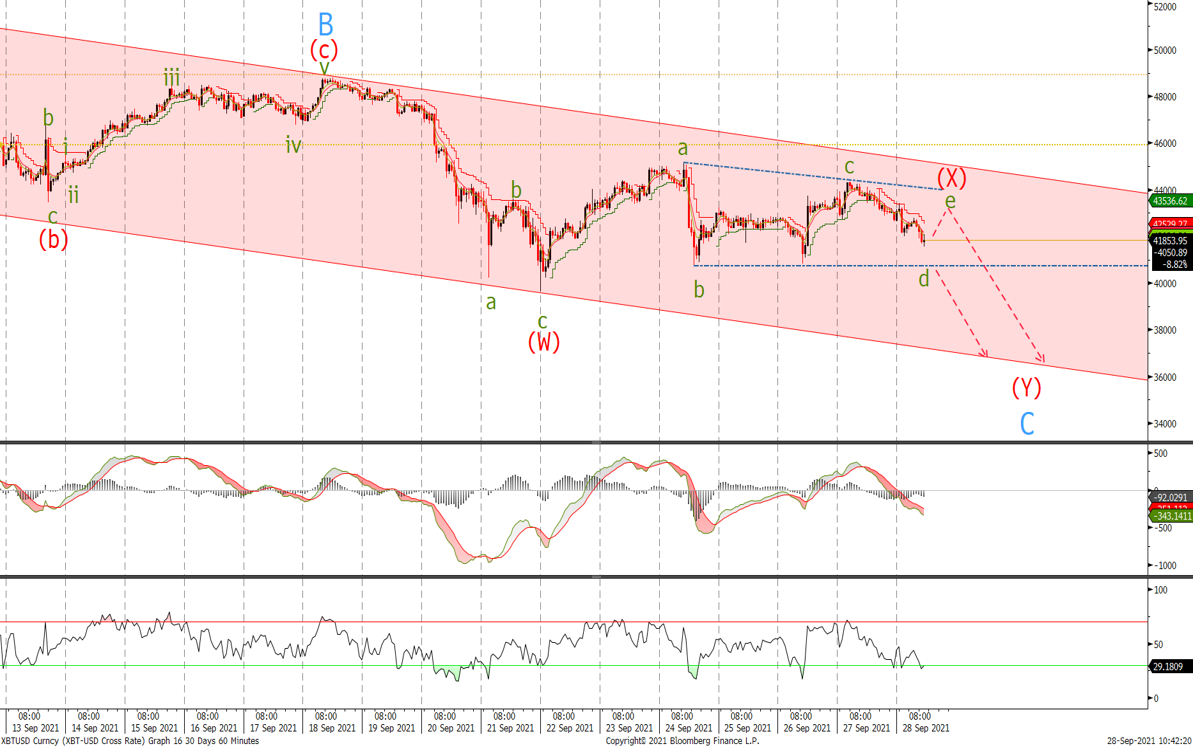
Last time we sold at 43'330 and started to ‘to buy around the 40'800 level followed by 38'000 expecting to see a low anytime for Bitcoin before the next what should be an impulsive move higher in wave 3’. Since the low we have bounced to 44'350 and currently selling off, it appears that we could be tracing out a triangle correction and whilst below 45'100, I will look for break of the wave b low at 40'735 for a push towards the bottom of the channel to complete the major correction before the next leg higher.
Ethereum
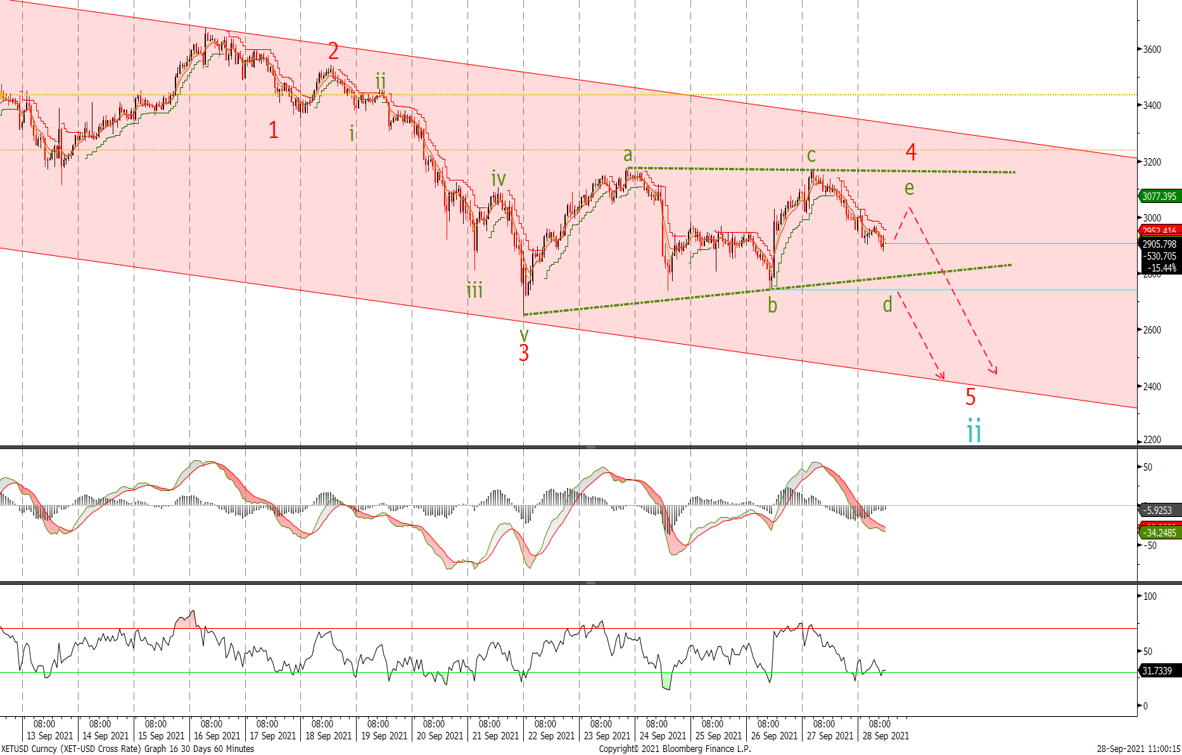
Wave 3 completed in line with last week's charts and therefore believe that we have been tracing out a corrective wave 4 triangle since then (this seems to occur far more often in cryptos than FX). Whilst trading below the top of the channel I will favour a final push towards the bottom of channel to complete wave ii which should be followed by a sharp acceleration to the topside. Look to buy around the 2400/2500 level.
Written by Matthew Clark
