
Bitcoin

Last time out 2 weeks ago I said ‘I believe we are tracing out a wave 2 correction which could see a sell off in the form of a zigzag to around the 45'000 level. If we fail to break 46'400, I expect to see triangle formation that will also ultimately lead higher, confirmed by a move above 50'490’. We were 1 week early on calling the end of wave 1 but the current sell off is in line with expectations and is close to completing so we will look at the short term chart to see if the time to buy is now.
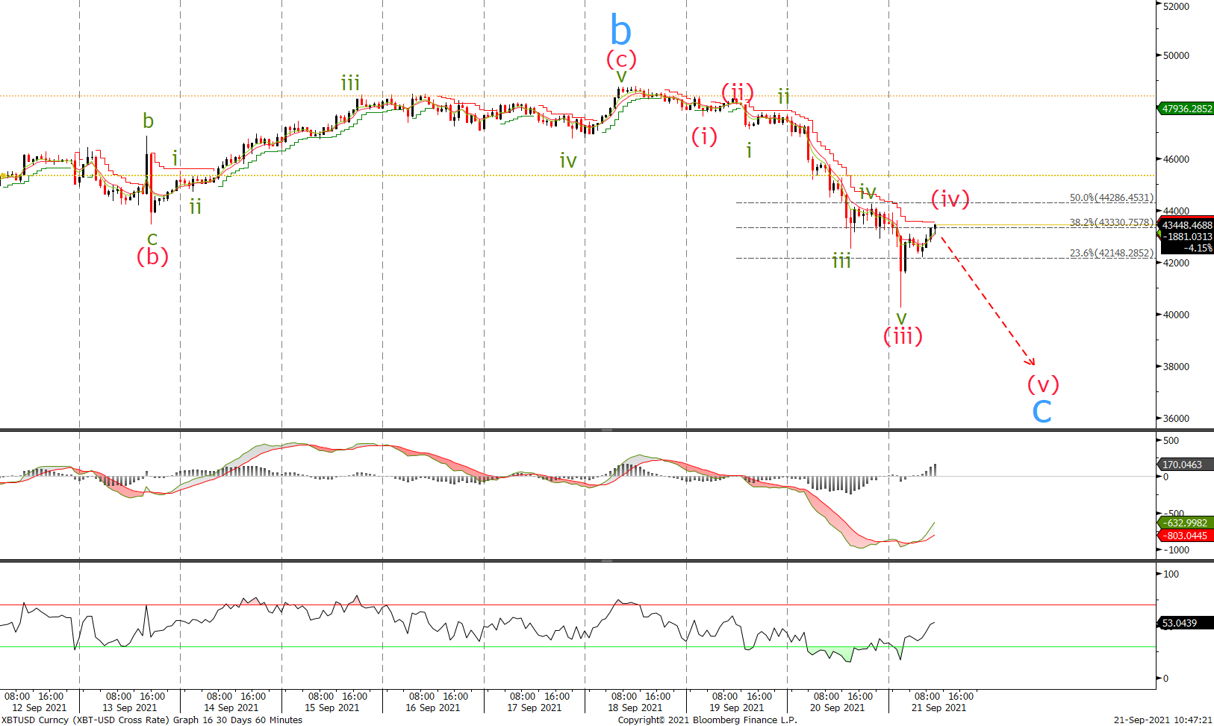
Looking at the last wave of the correction down, we can see 3 waves down (iii) and we are currently retracing in a wave (iv) correction. We would look to sell at current levels and at the 50% retracement level looking for a sell off below todays lows towards the 40'300 level. We would start to buy around the 40'800 level followed by 38'000 expecting to see a low anytime for Bitcoin before the next what should be an impulsive move higher in wave 3.
Ethereum
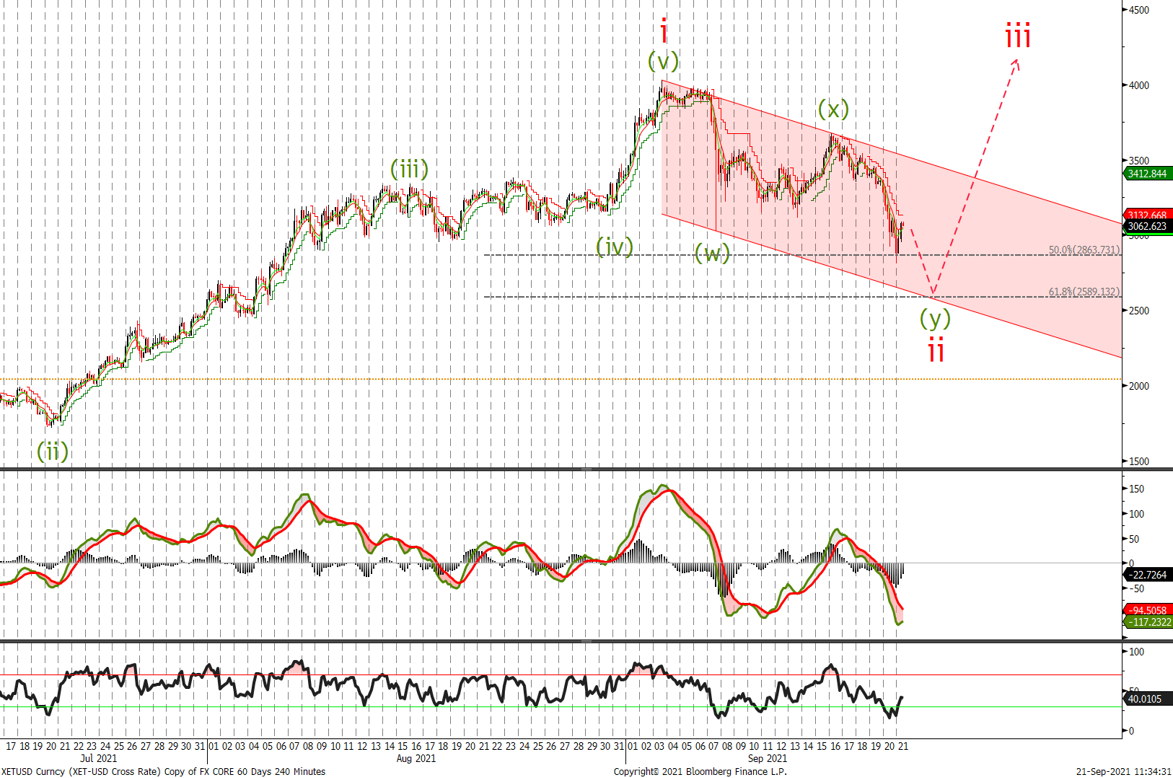
Last time out we said ‘We would look to buy at current levels and add on a move up through 3'393 for a minimum test of the 3'870 area followed by a test of the 4'000 handle’. We traded as high as 4'057 to complete 5 waves up and are currently correcting in 3 waves like Bitcoin. We would look to buy around the 2'590 level the 61.8% level and the bottom of the channel. Lowering stops to the 1'700 level.
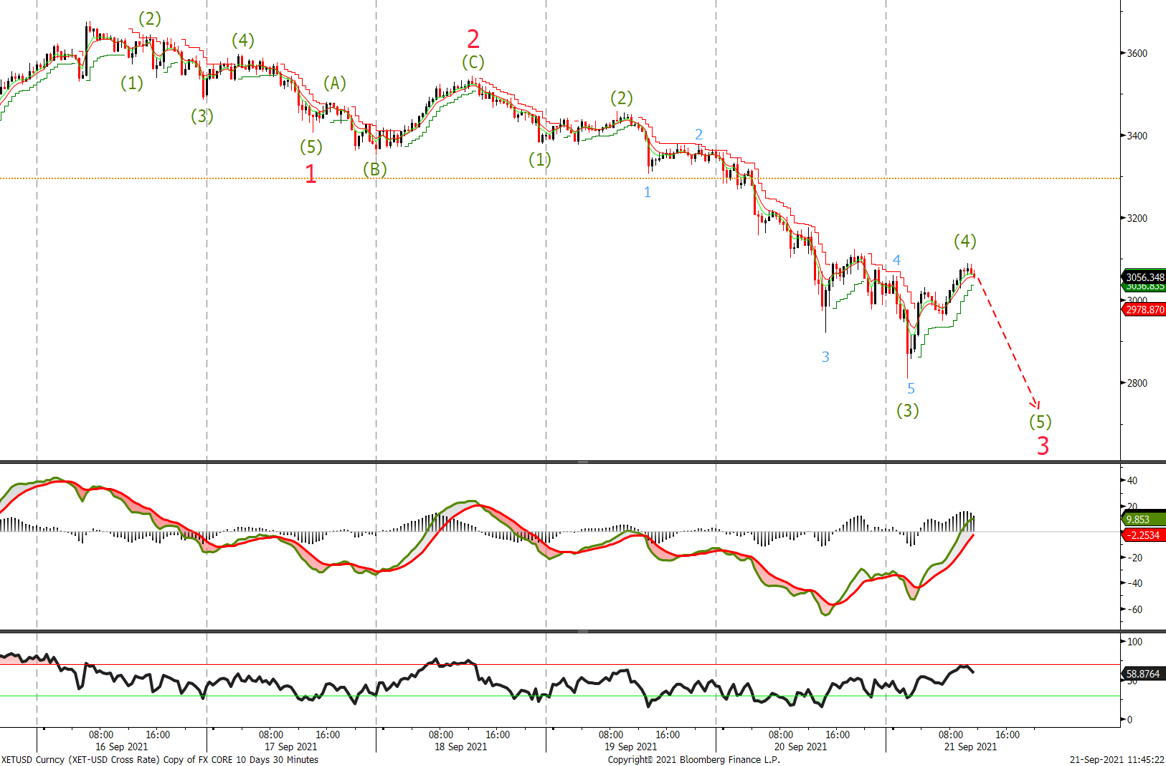
Looking at the short term chart whilst below the wave 1 low at 3'405 we will continue to look for ETH to trade lower to the levels mentioned on the previous page. A move back below the 2'950 level would be the first indication that the current short term correction is over.
Written by Matthew Clark
