
Bitcoin
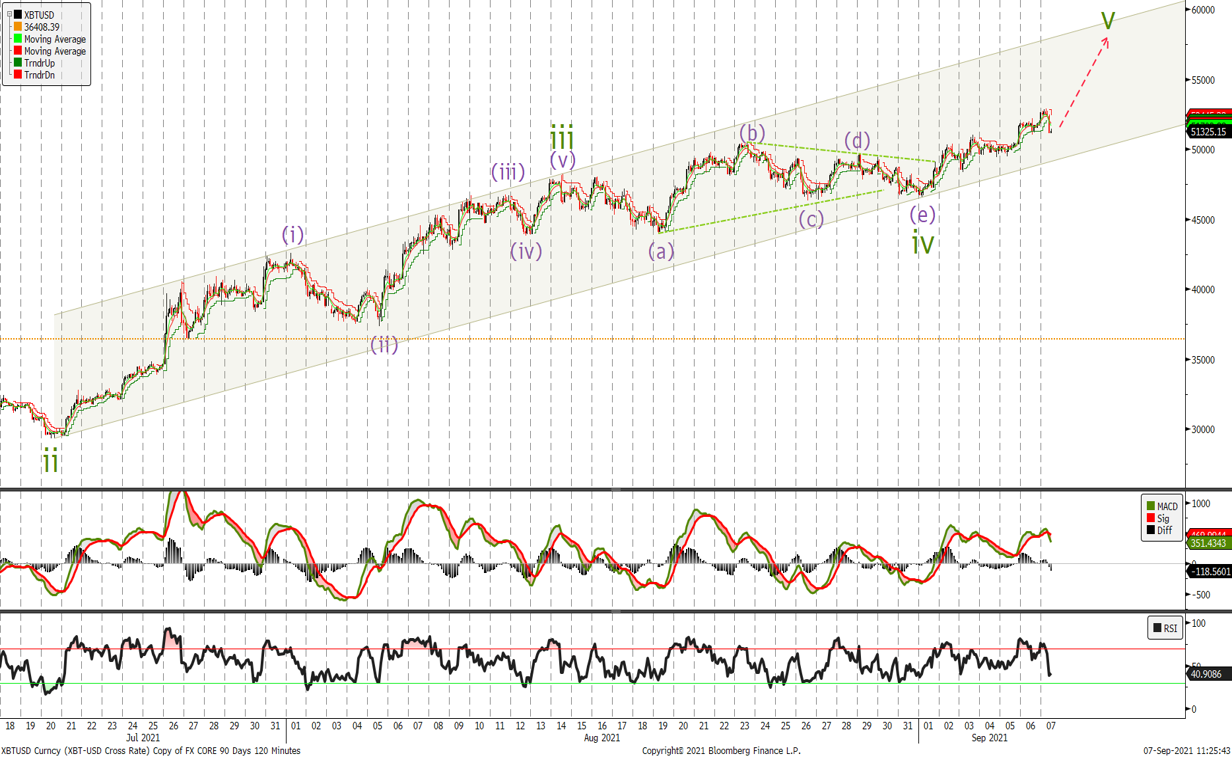
I am showing the longer term chart here that shows the wave count off the summer lows. The latest push is the final wave up to complete Wave 1 of the longer term rally towards the top of the channel.
We will look at the short term chart next to see if we are close to completing this leg higher
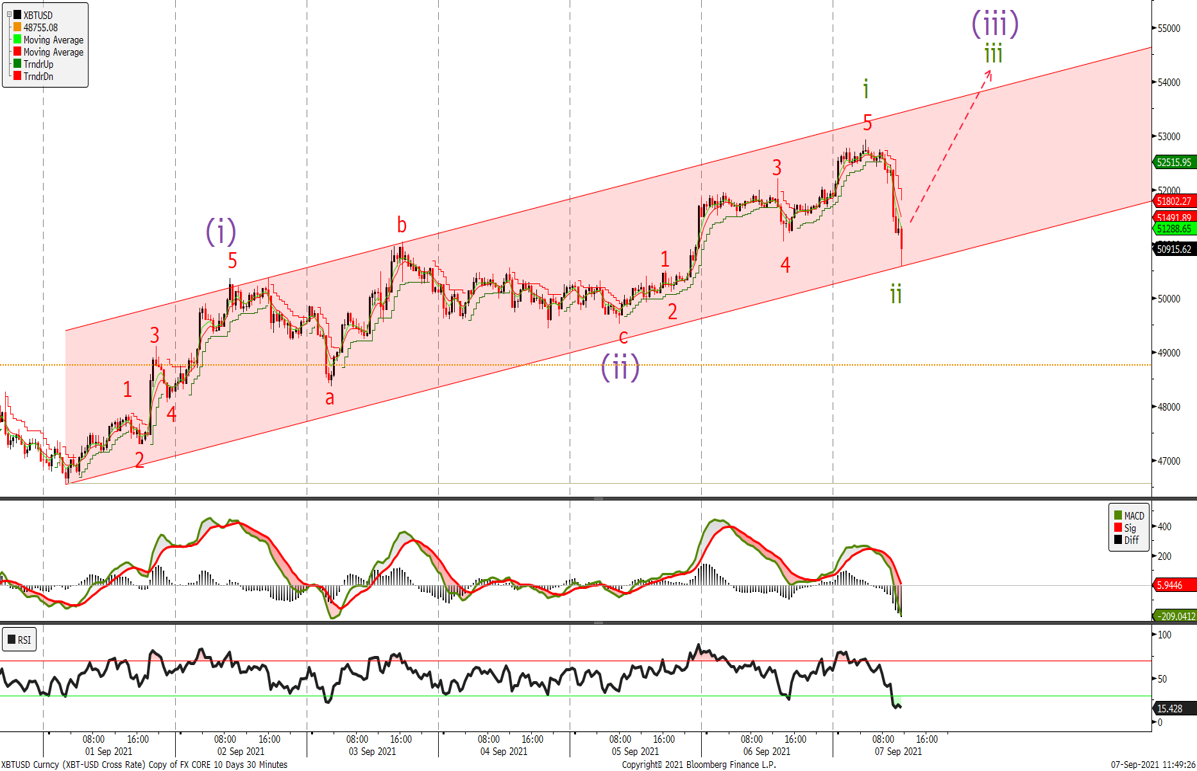

The retracement to the 45'000 level we were looking for stopped at 36'500 before rallying above the 50'000 level in line with our bullish view. We should see a sharp acceleration higher and I would buy now add at 49'600 with stops below 48'200 looking for an initial test of the top of the channel followed by 55'690 level. Look to add on dips until 5 waves look complete to the topside.
Ether
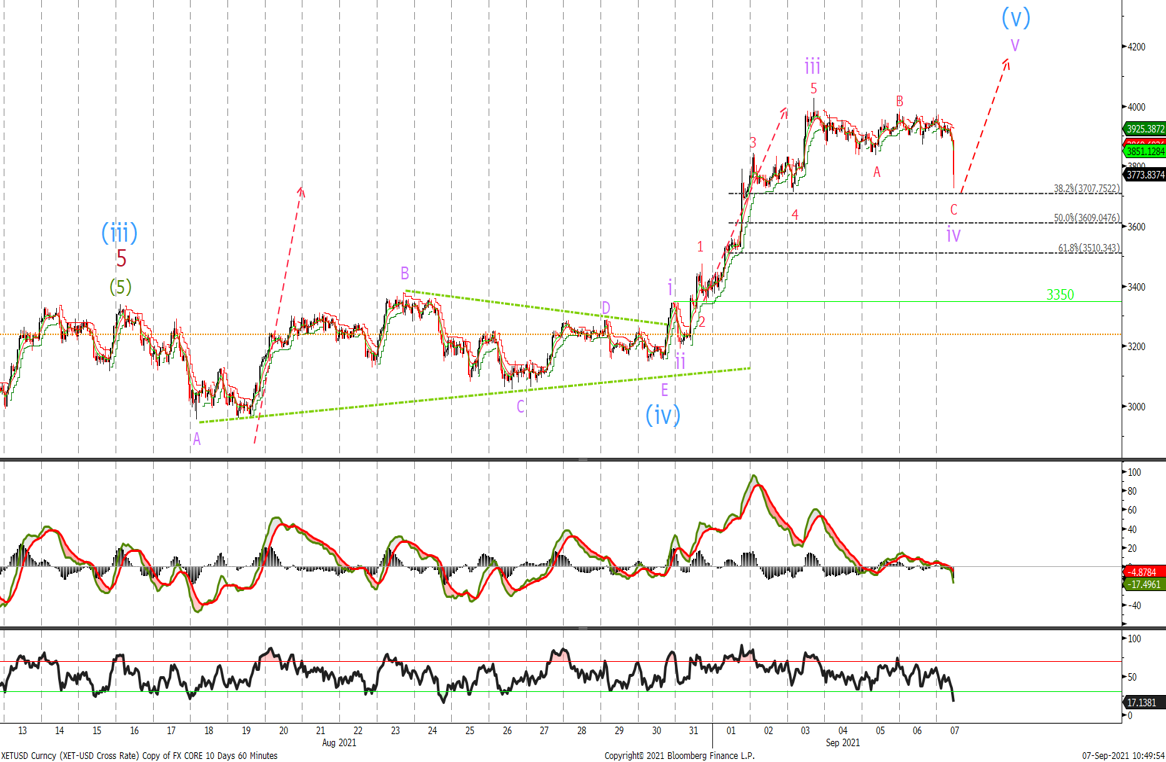
Last week we nailed it when we said ‘would look to buy at current levels and add on a move up through 3'393 for a minimum test of the 3'870 area followed by a test of the 4'000 handle.’
We traded to 4'030 to complete Wave iii and have since sold off in 3 waves to test the 38.2% retracement level. I would buy now at 3'765 add at 3'609 and again at 3'510 with stops at 3'340 for new highs towards the 4'200 level.
