
Bitcoin
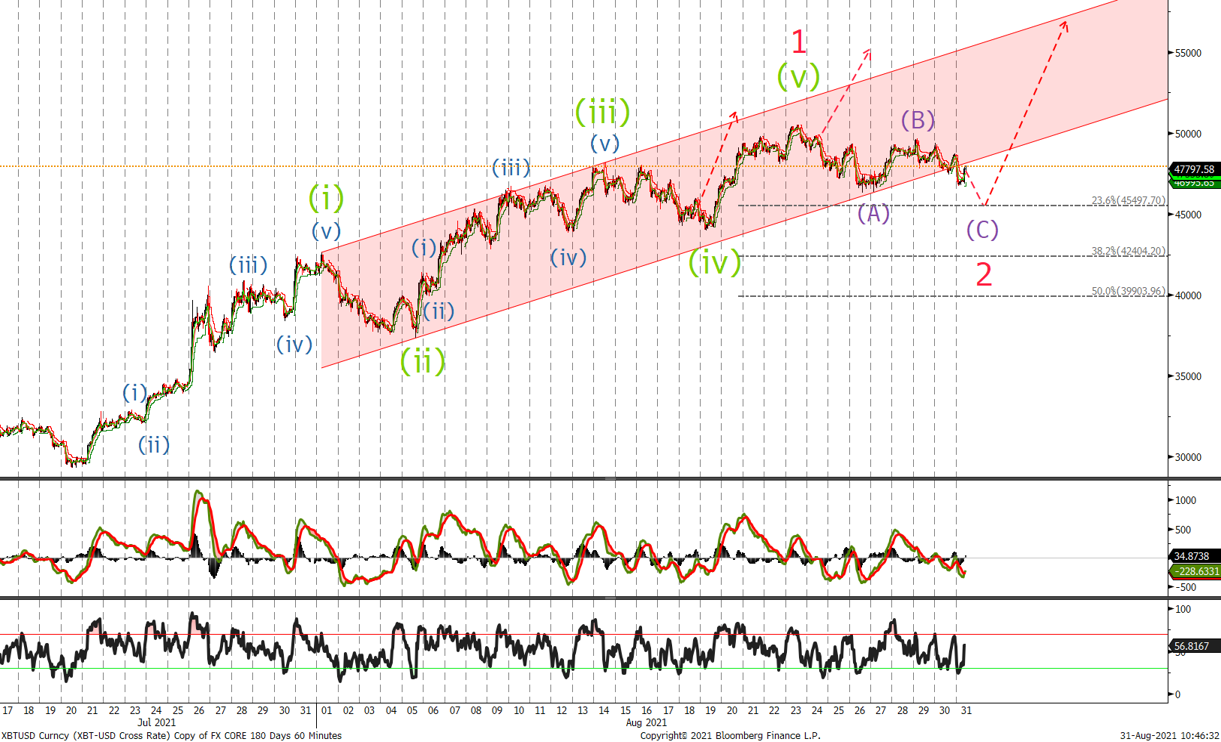
I have relabeled the chart to show the completion of the first wave up from the July lows. I believe we are tracing out a wave 2 correction which could see a sell off in the form of a zigzag to around the 45'000 level. If we fail to break 46'400 I expect to see triangle formation that will also ultimately lead higher confirmed by a move above 50'490. We would look to buy a break there and buy at the retracement levels on the chart with stops below 37'000. Looking for further strength in the coming weeks.
Ethereum
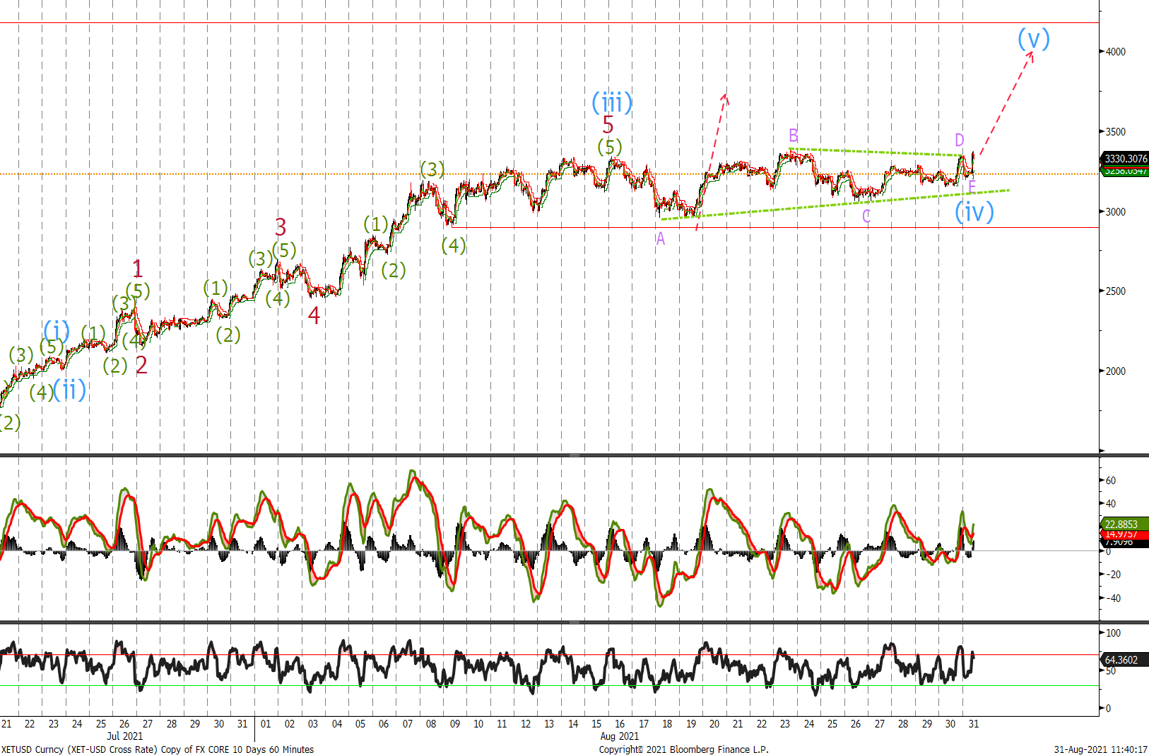
No change in our ETH view , we were looking for a test of the 3500 level minimum after the wave (iv) triangle correction. We would look to buy at current levels and add on a move up through 3393 for a minimum test of the 3870 area followed by a test of the 4000 handle.
A move below 3057 would target 2890 where would look to add to long. Place stops at 2447.
