
Bitcoin Weekly Chart
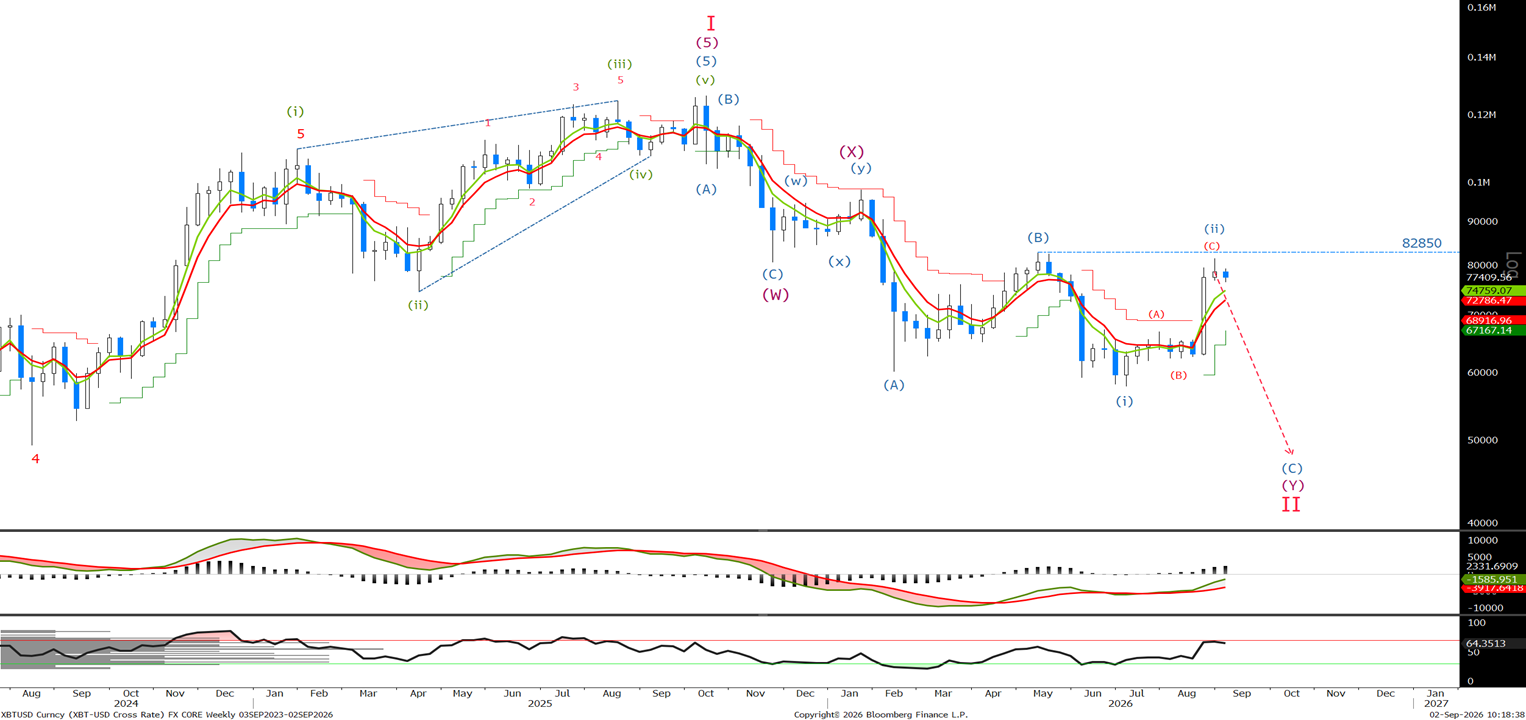
No change on the weekly with 'The limit for wave (ii) is 82850. Let's look to the short term to see how far along we are in wave (C) and if it looks like ending before 82850.' I remain bearish whilst below that level.
Bitcoin Daily Chart
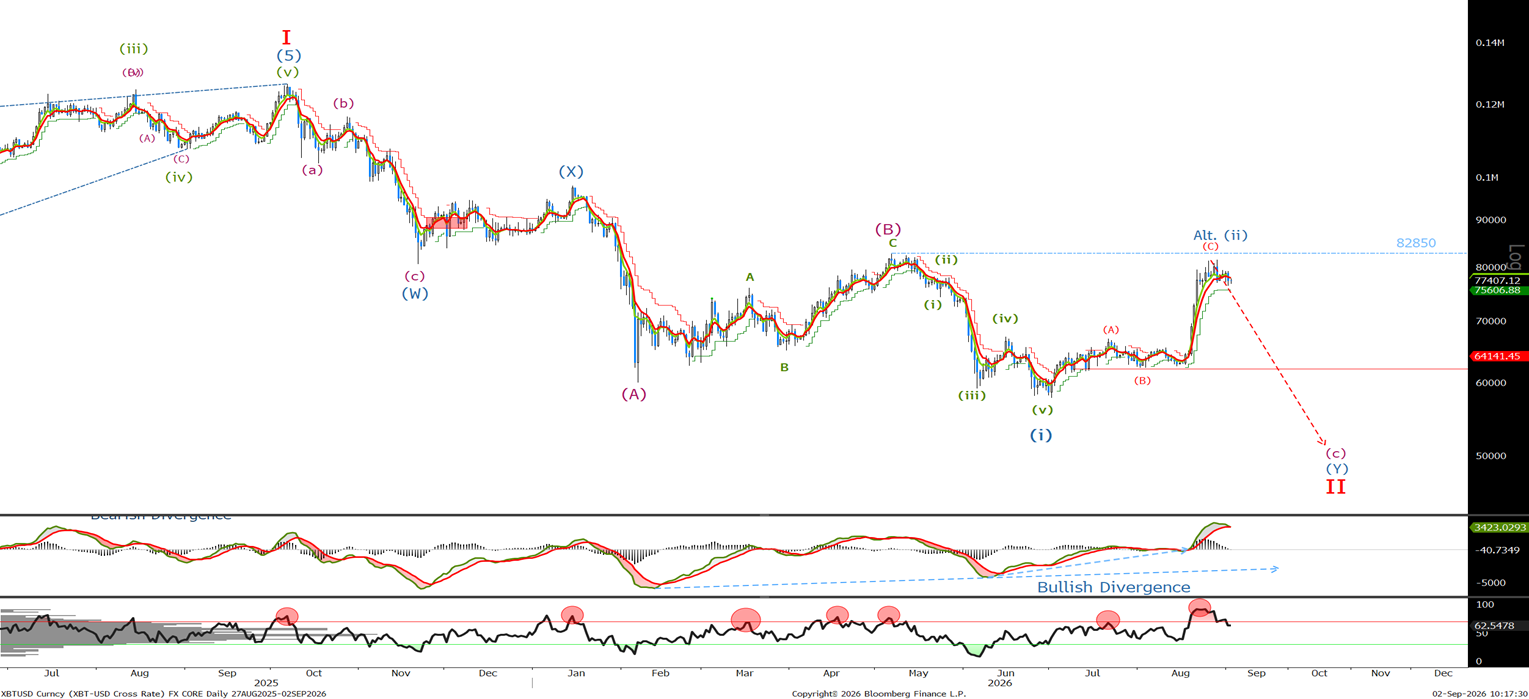
Last Tuesday I said 'We are approaching the 100% retrace level at 82850. We are currently trading at 80150, so I am selling now with stops above 82850.’ We made a slightly new high at 81441 before trading off to a low yesterday at 7693. If not short sell now at77110 with stops above last week's high.
Bitcoin Short Term Chart
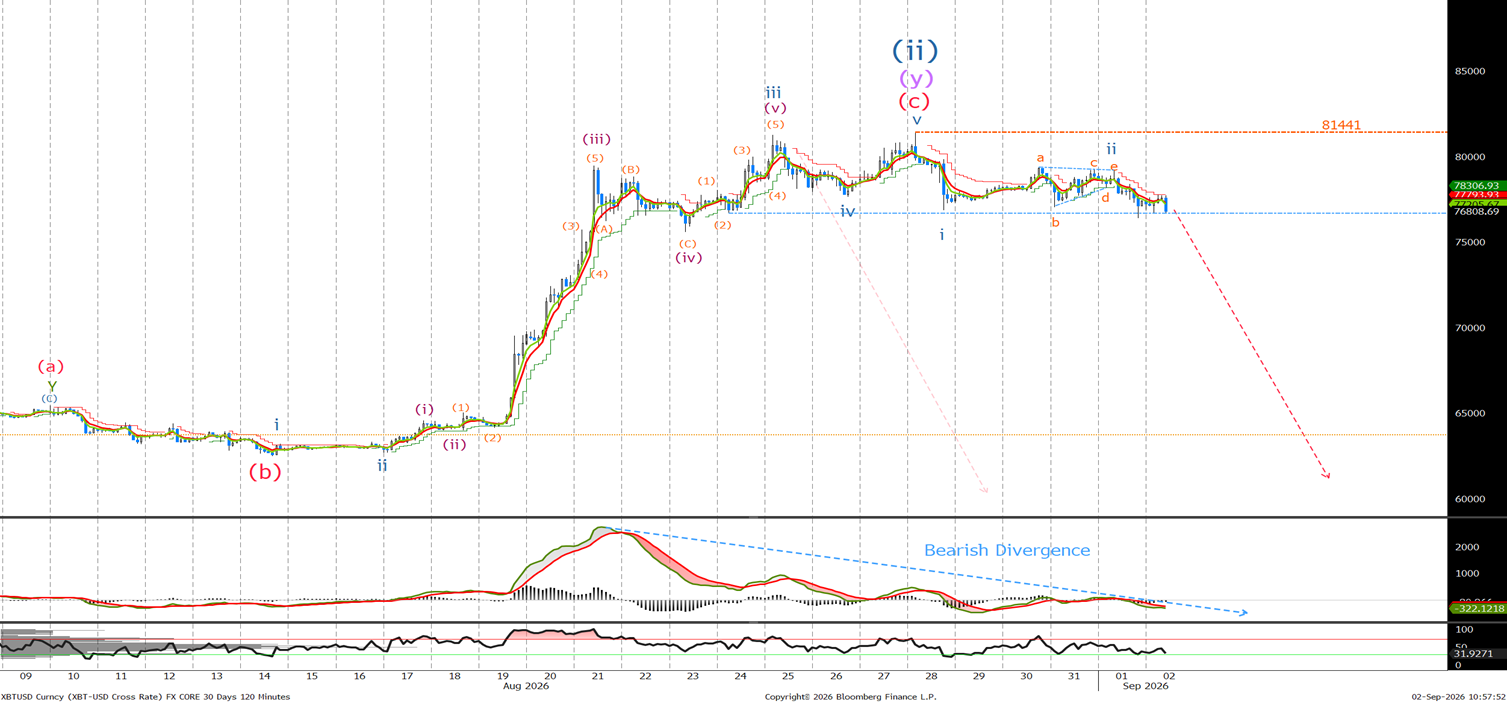
Last time we said 'I can count 5 waves higher, so I believe we have seen a top and, on a risk-reward basis, if correct, would make at least 20k. So sell now at 80200 with stops at 82850. Or sell on confirmation with a 2-hour close below 78450, placing stop above 82850 or the most recent high.’ Either way, we are now making money. Leave stops at 82850 or slightly above last week's high. Given the bearish divergence, I expect to see an acceleration on a 2-hour close below 76650.
Ethereum Long Term Chart
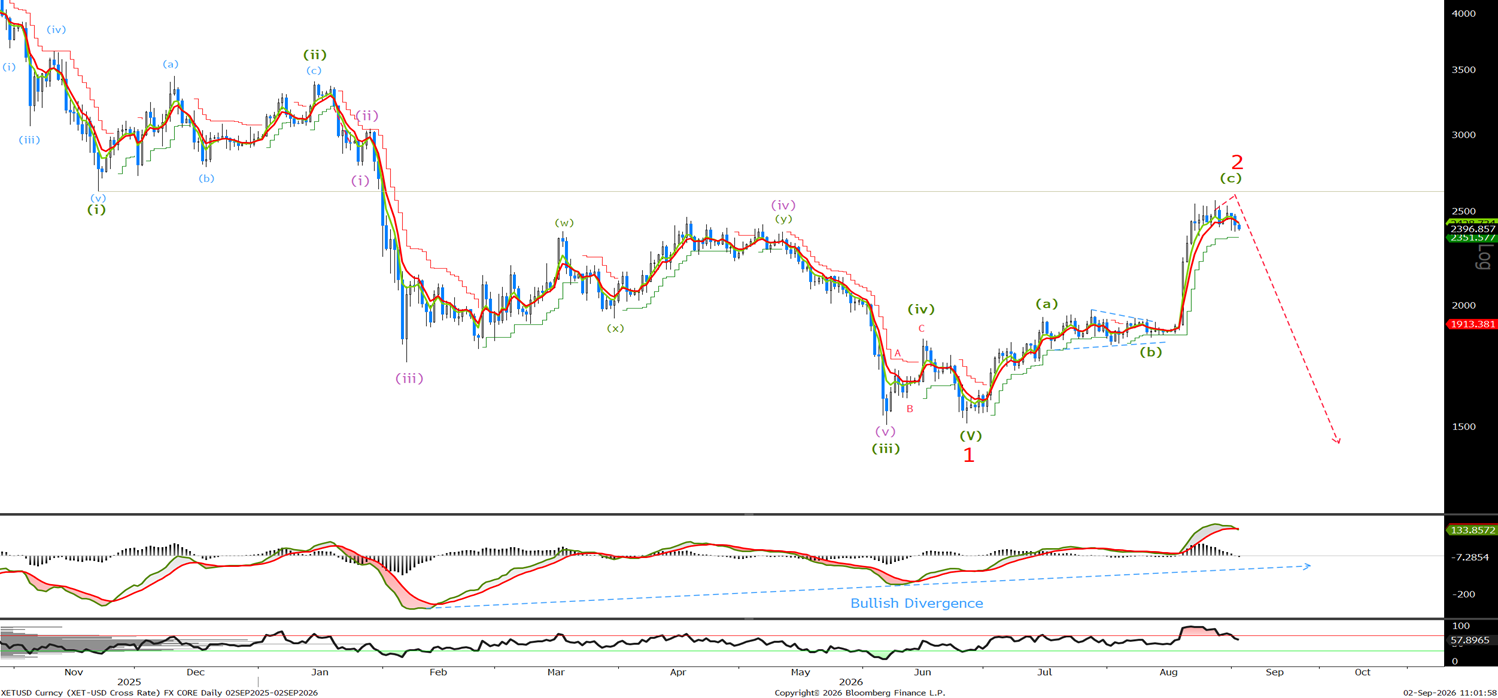
Last week we were looking for slightly higher, stopping below 2620. We haven't broken that level and, on a daily basis whilst there, I expect to see wave 2 ending. Let's look at the short-term chart to see if there are any clues. A daily close below 2350 should confirm the downtrend has resumed.
Ethereum Short Term Chart
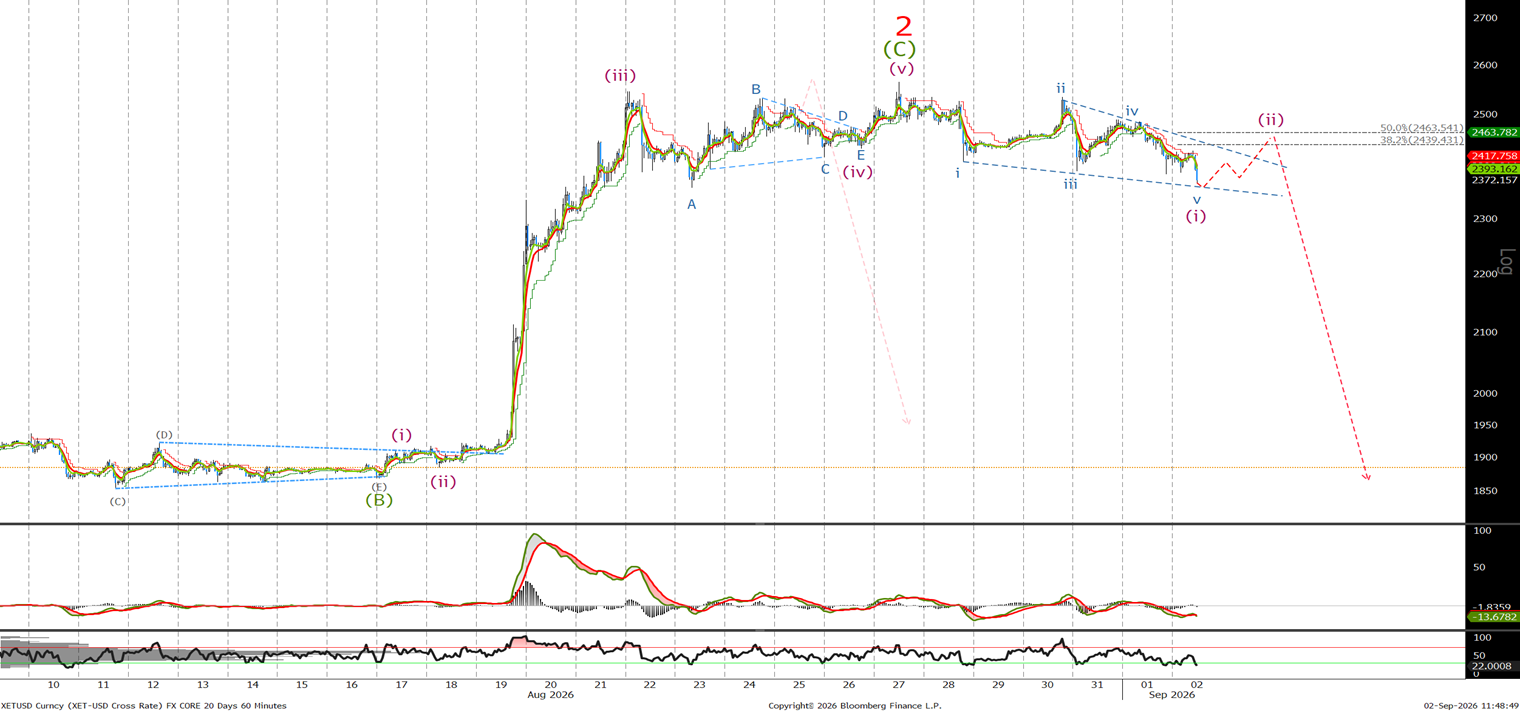
Last time we said, ‘I believe we have one new high to make above 2531 before the sell-off resumes. Given the divergence in the MACD I will look to sell up there and add on a confirmation that a top is in place on an hourly close below 2350, placing stops above the last high.' We traded up to 2565, and it appears we are close to finishing the 5 legs to complete wave (i). Place stops above 2570 now. If not short, look to sell on a correction back to the 2439 and 2463 levels.