Bitcoin Weekly Chart
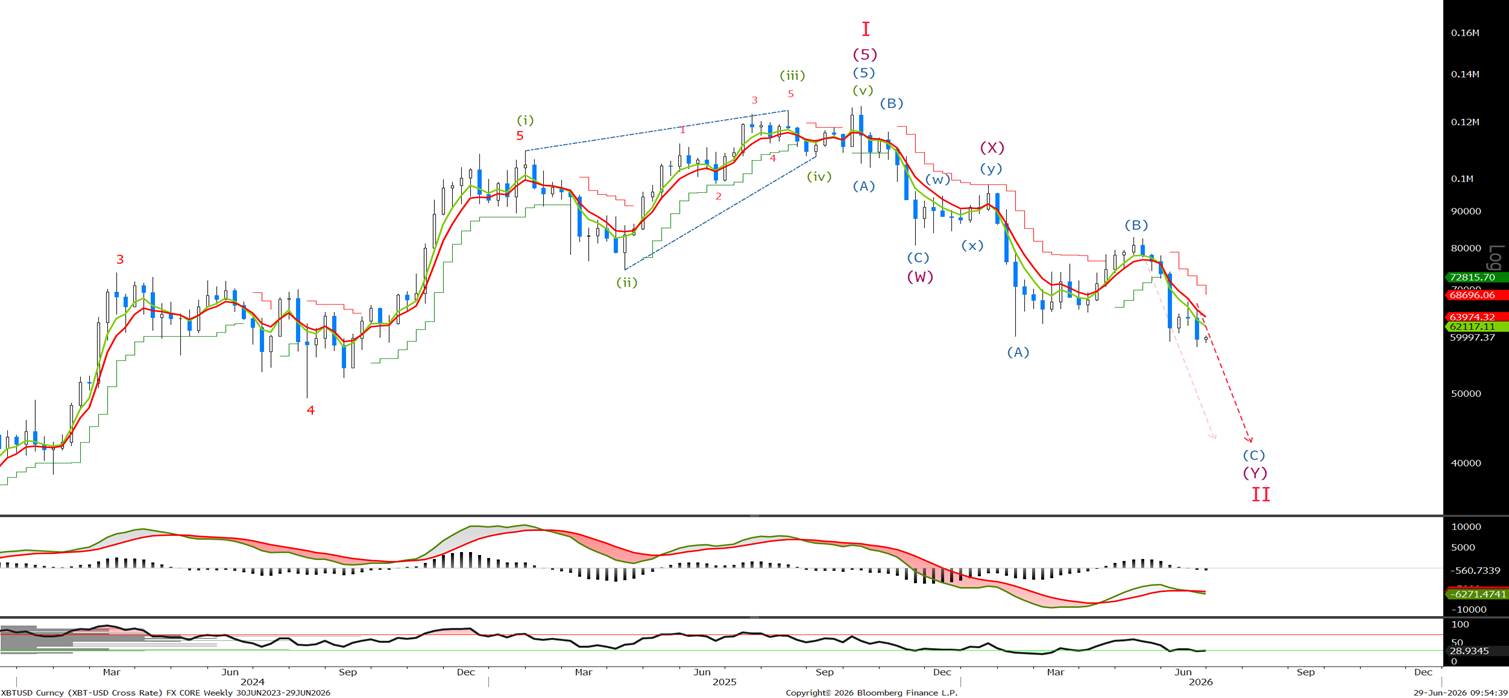
We remain bearish whilst below 82810 on a weekly basis. A weekly close above 73200 I would need to reassess the count, but would still remain bearish. But we need to break down the short-term charts to see how much in the final leg of the correction we are.
Bitcoin Daily Chart
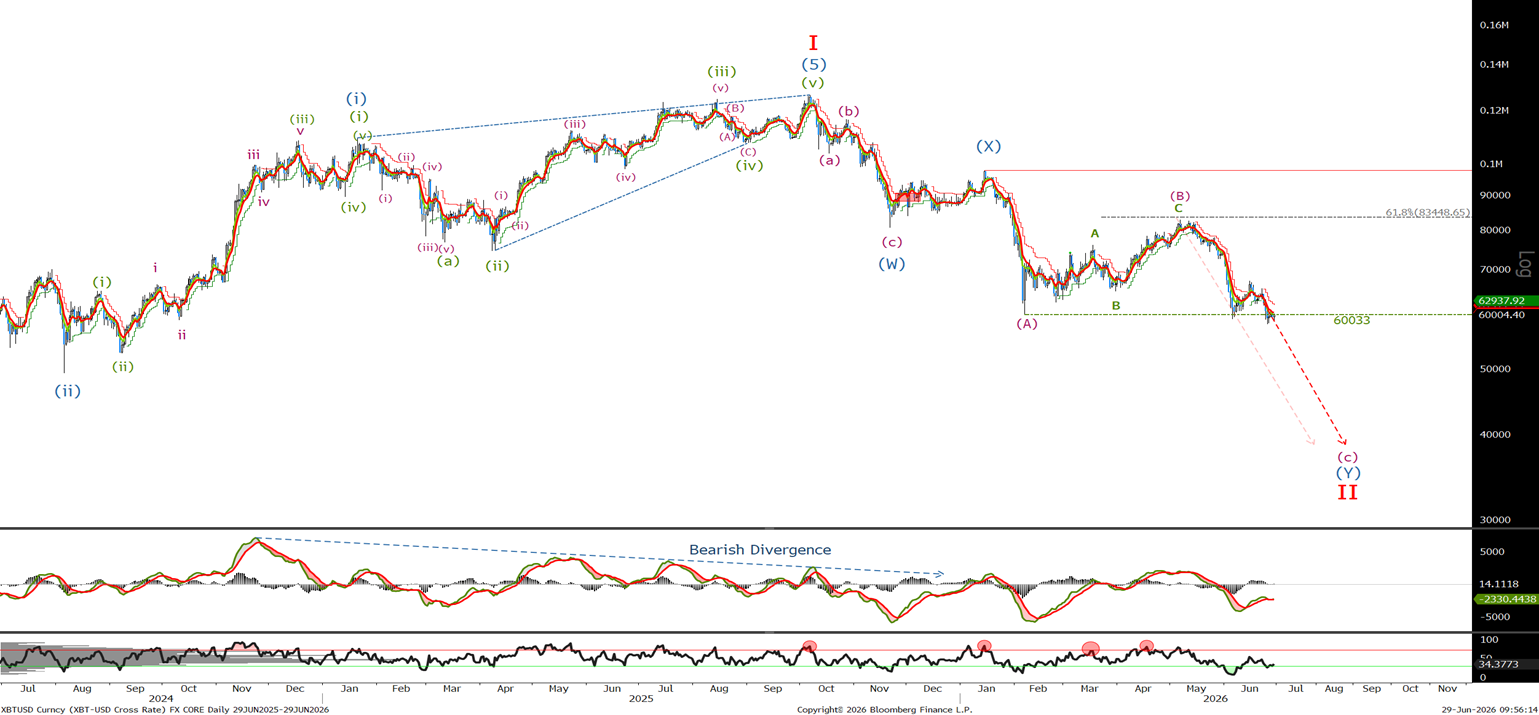
Last time we said 'we have corrected the low, possibly giving us a great sell opportunity. Let's look to the short term to see possible sell levels.' As you can see on the daily we have sold off inline with expectations, but how far along are we?
Bitcoin Short Term Chart
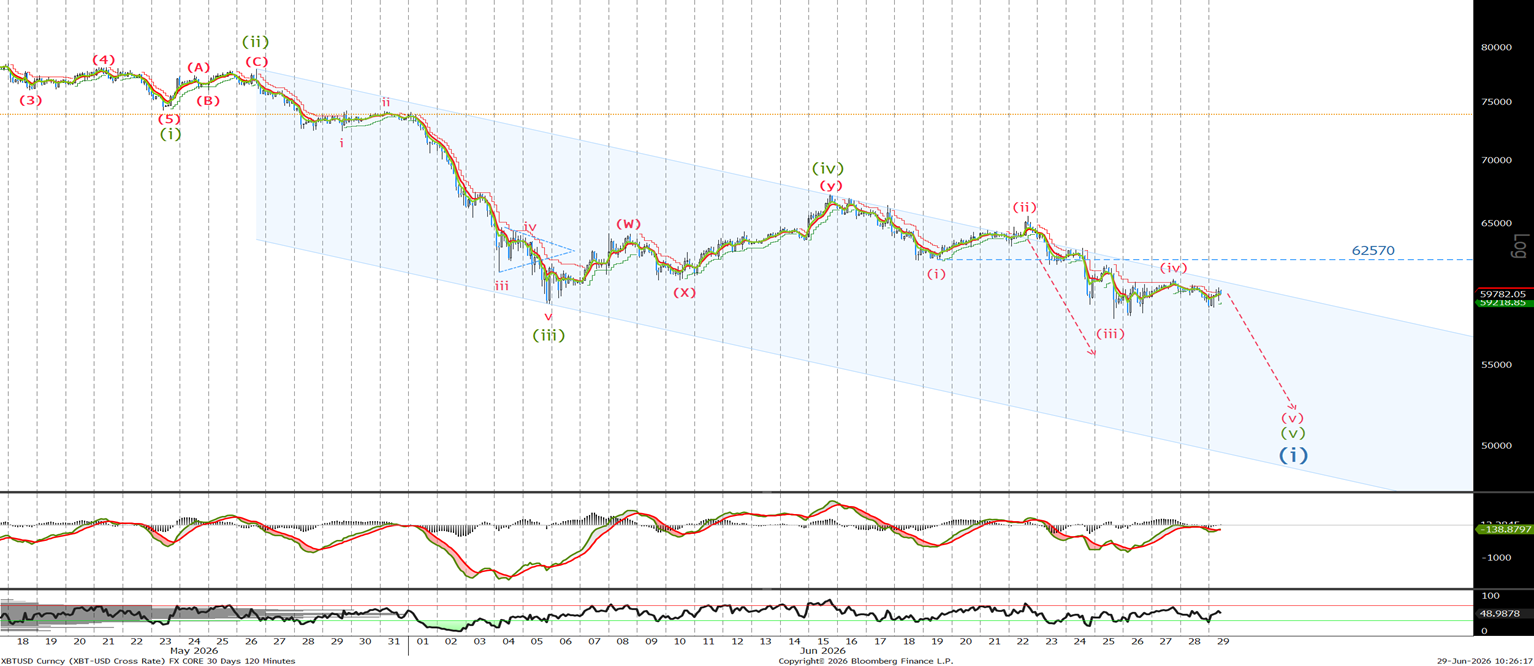
Last time I said, 'I would use the wave (iv) high in the short term as a stop loss level. If not short, sell at 64380 and again at 65340 with stops at 67600.' We traded at 65548, so I hope you sold. Since then, we have sold off and ranged in what appears to be corrective price action for wave (iv). We could trade slightly higher, but must remain below the wave (i) low before making a new low to complete 5 waves of this leg lower. Once a new low has been made, or we trade above 62570, I think we will see a larger retracement up towards the 38.2% level at 67020 and the area of the previous larger wave (iv).
Ethereum Long Term Chart
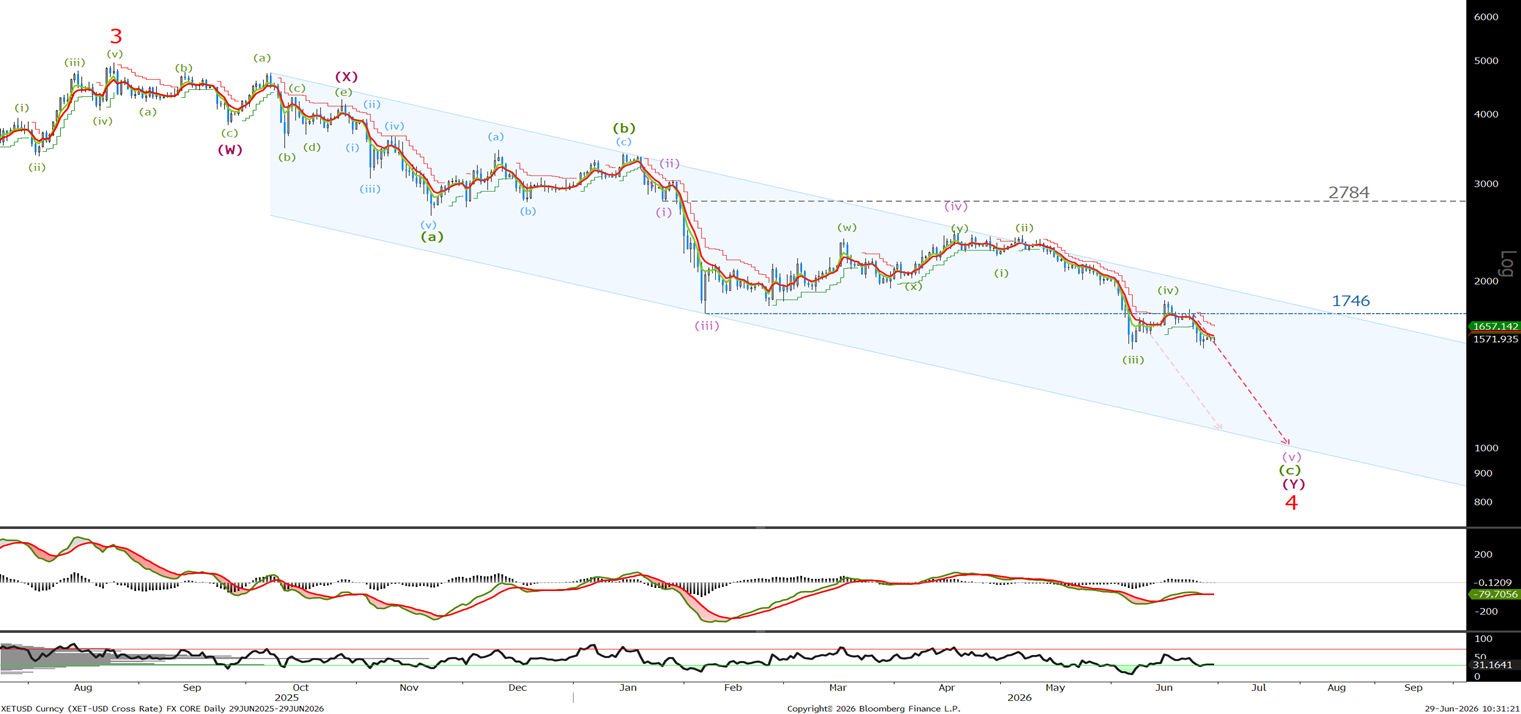
On the daily ETH chart last time, I said ‘As you can see, I have labeled the correction as a wave (iv) and on a daily basis, whilst below 2220 I will continue to look for lower.’ looking for a break below 1505 to complete 5 waves lower. But we need to see where we are in the short term.
Ethereum Short Term Chart
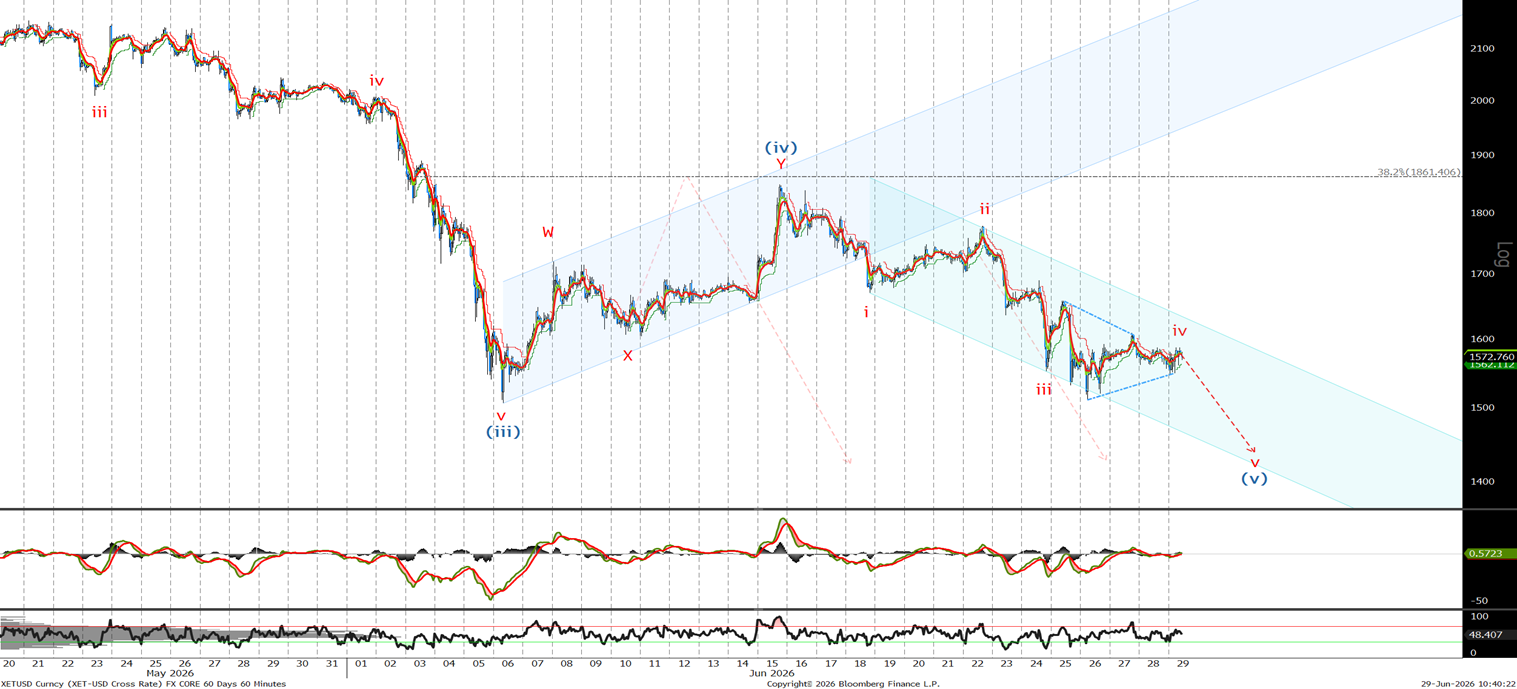
Last time we said ‘'We traded to a high of 1848, just shy of the 38.2% retrace level at 1861. I am selling now at 1747 with stops above 1880 or 2020.' We traded higher to 1778 before selling off to a low of 1510, and I believe we are currently correcting in a wave (iv) triangle that implies another push to new lows whilst we trade below the wave i low at 1670.
Ethereum 15 Minute Chart
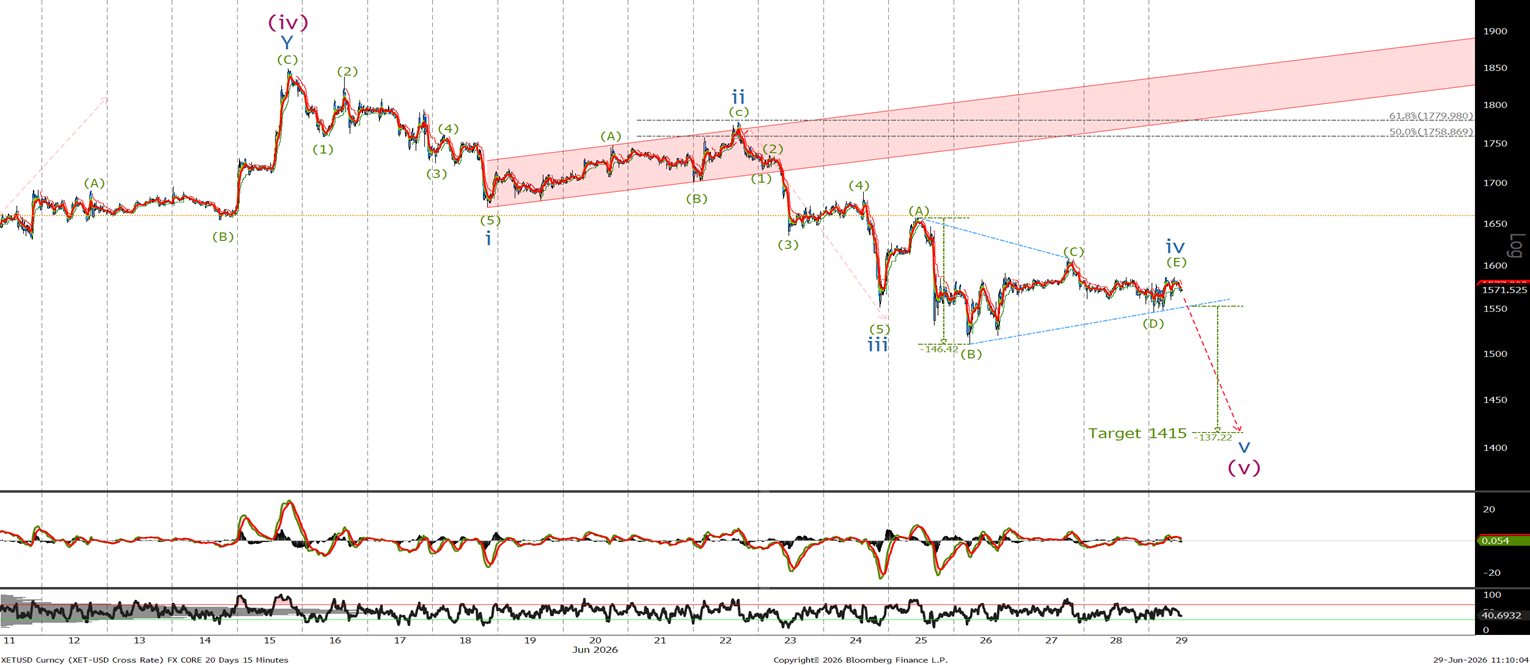
As you can see from the ghost arrows in the very short term, I have been correct the last few weeks, so let's look at the 15-minute chart again. Last time I said, 'Given this is a 15-minute chart, we are really trading a very short-term view, but I have broken it down again, and I would look to sell at 1758 and again at 1770, 1780 with stops at 1860.' We traded to 1778 enabling us to sell twice, lower stops now to 1670 guaranteeing a 100 dollar profit. Looking at the triangle correction, we should have a target around the 1415–20 level and will start to take profit as we approach that area. If not short, sell now at 1562 with stops at 1670.
