Bitcoin Weekly Chart
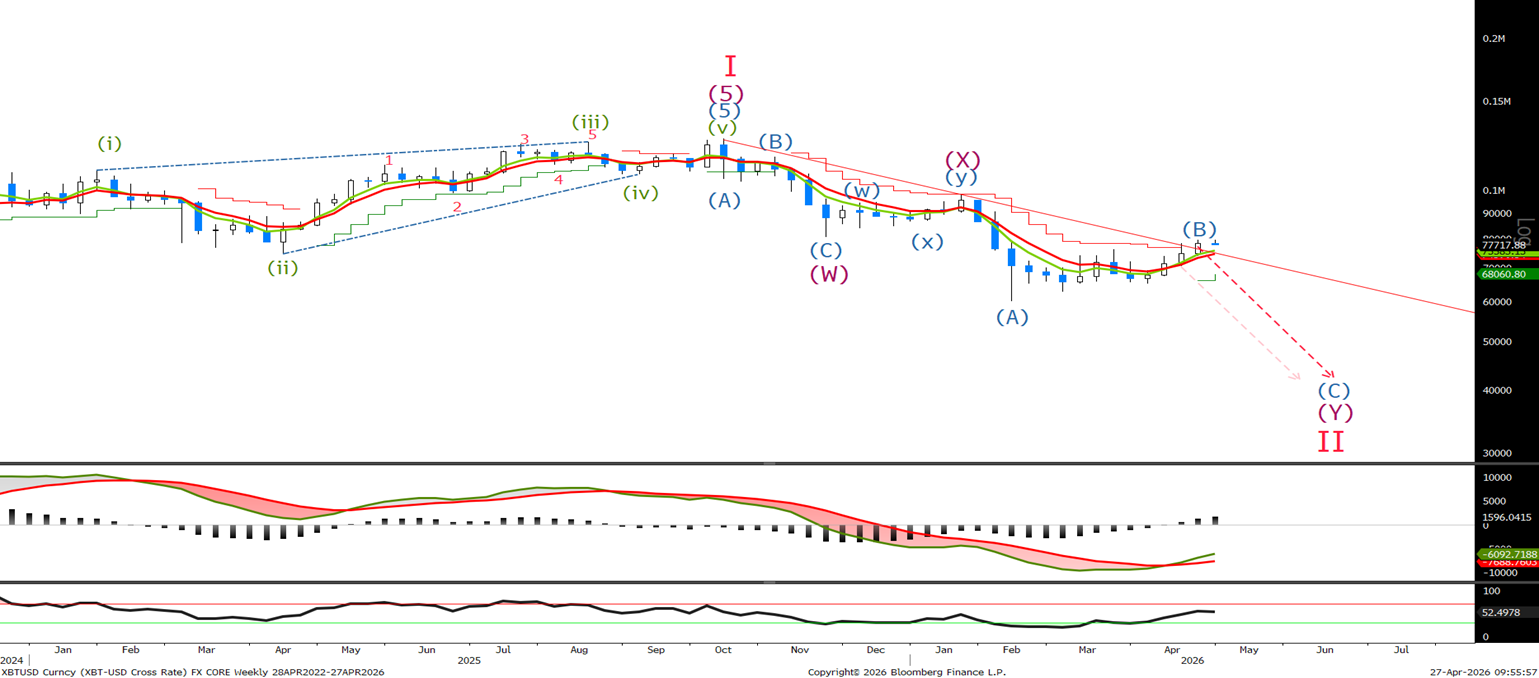
No change ‘On a weekly basis we continue to look for lower whilst below the wave (X) high, Lets look to the shorter term to see how far along wave (B) we are.’ We closed last week just above the trend line last week, but we need to trade above 97923, the wave (X) high to negate the bearish view on a weekly basis. Let's check the shorter time frames to see if wave (B) is close to ending.
Bitcoin Daily Chart
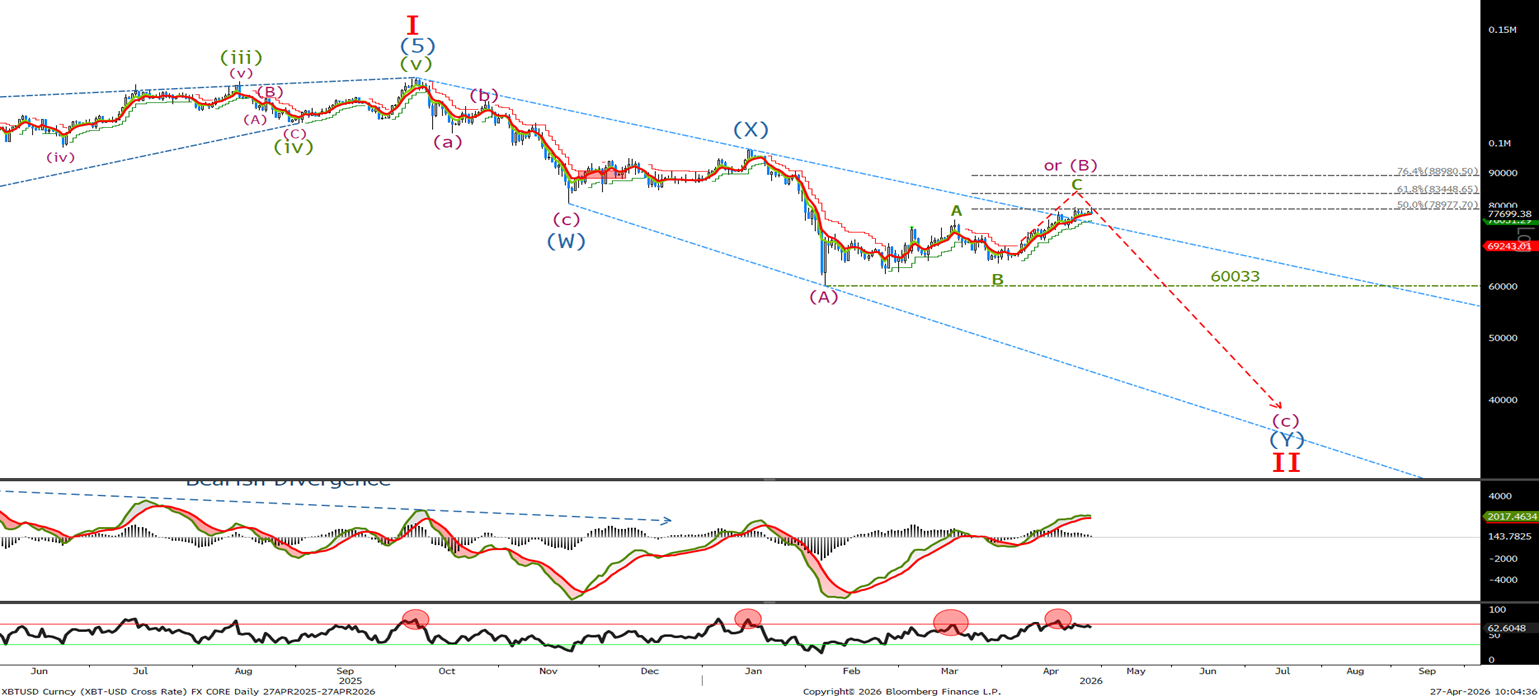
Last week we said, ‘We have tested up to the top of the channel and just short of the 50% retrace level at 78977. I am happy to sell at the current level and add at 84.4k and 89K with stops remaining above the wave (x) high.' Since the last update the 50% retrace level has been tested several times with a new high this morning at 79488. No change in the view so if not short I would look to sell on a daily basis.
Bitcoin Short Term Chart
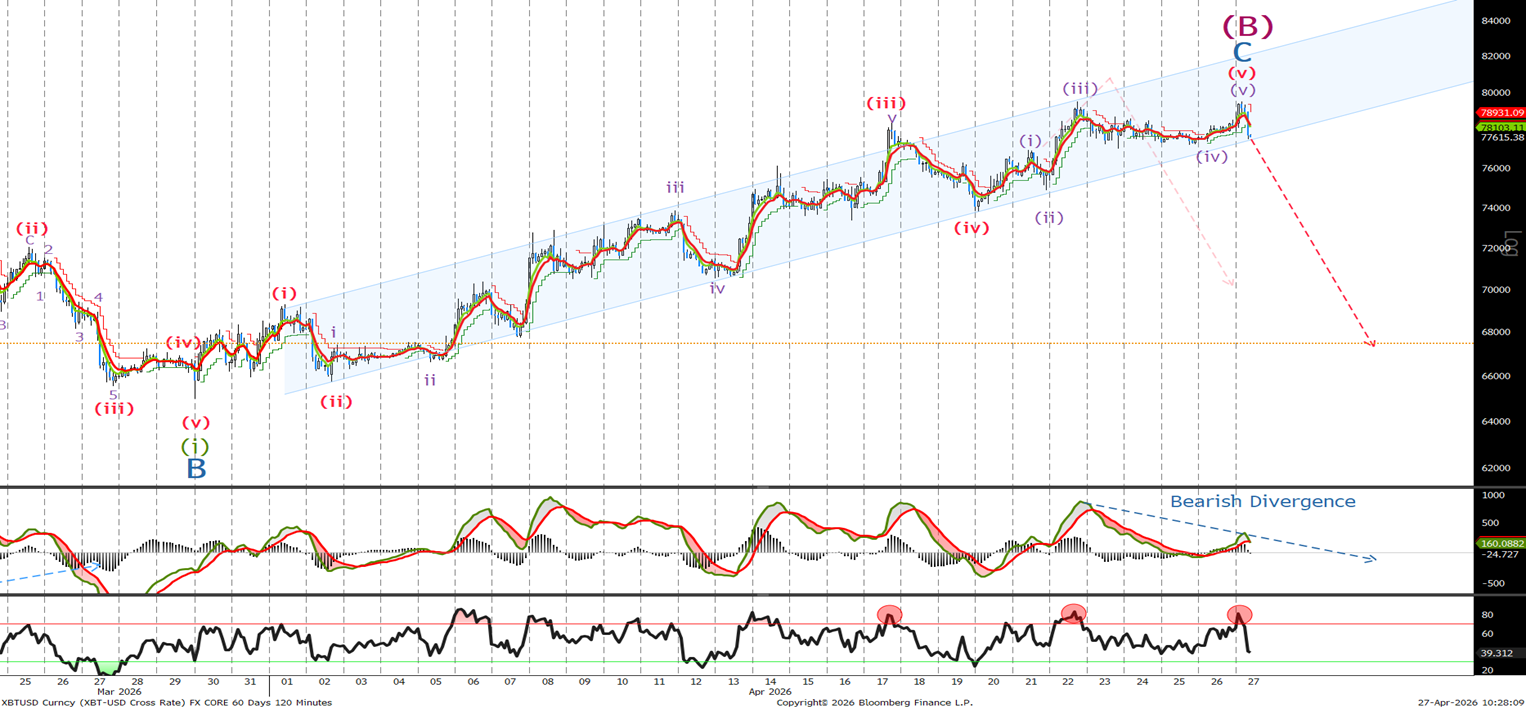
Last week we said 'it appears we have to make a new high above last week's wave (iii) 78343. Look to sell on rallies at the levels mentioned in the daily chart.' This morning we made a slight new high before sharply reversing . Given the divergence in the MACD, I believe this slight new high is the end of wave (B). A 2-hour close below the channel followed by a close below minor wave (iv) at 77181 will confirm that wave (C) to new lows is underway.
Ethereum Long Term Chart
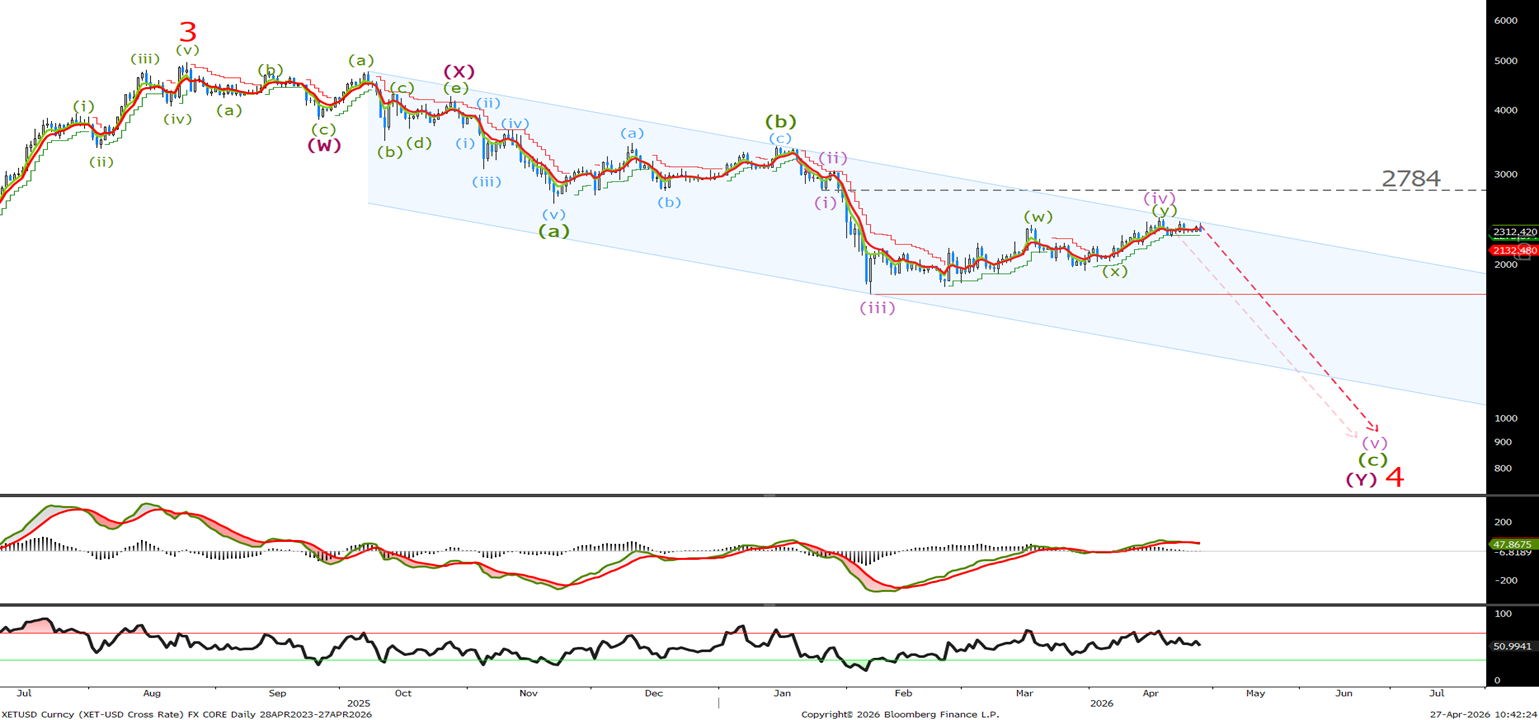
For the past few weeks, we have said ‘I am happy to sell now as we test the top of the channel at 2085 with stops above 2784. Expect an acceleration lower on a break of 1746.’ As you can see, there is no change in the view as we continue to test the top of the channel. If not short sell now with stops remaining at 2784.
Ethereum Short Term Chart
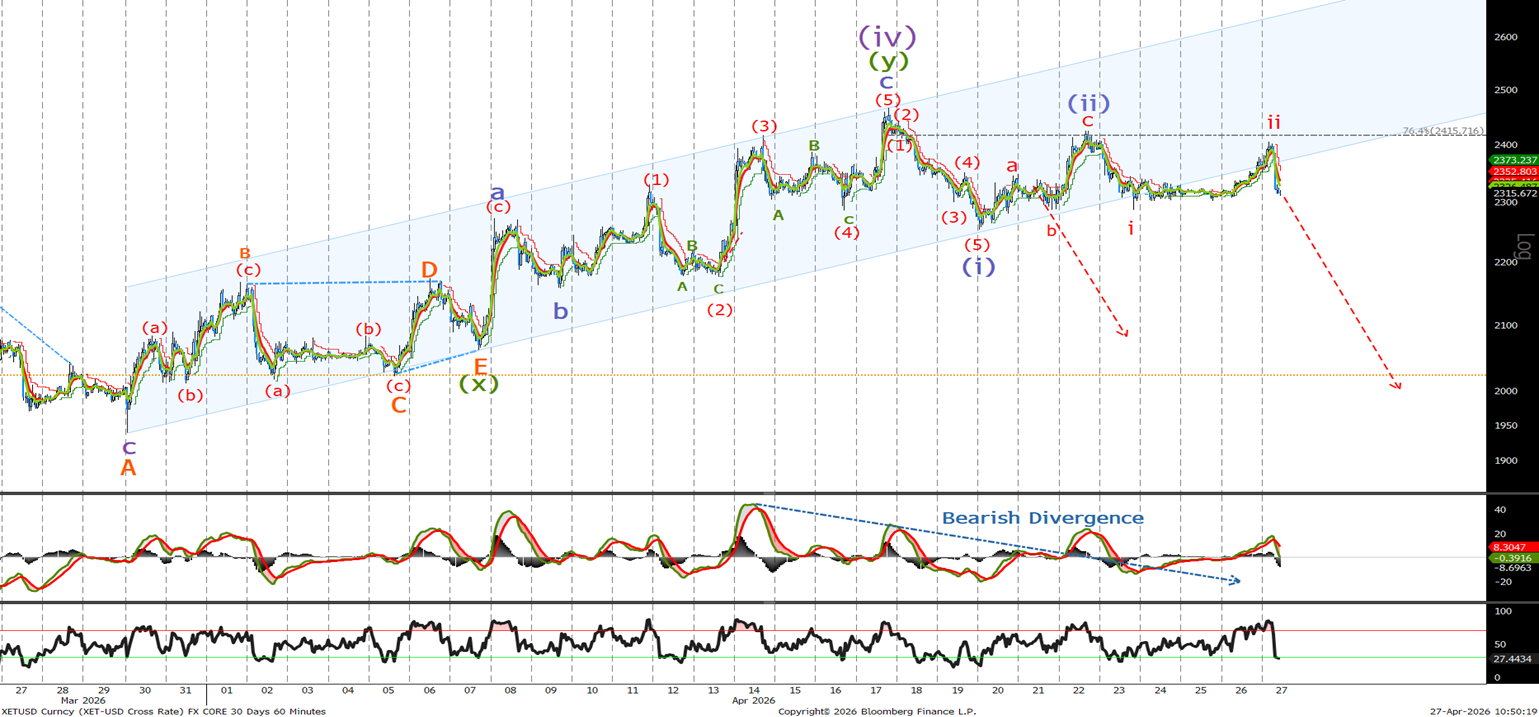
Looking at the hourly chart, you can see we retraced back to the 76.4% Fibonacci level to complete the 3-wave correction for wave (ii). I am happy to stay short , if not short sell now with stops above the wave (iv) high at 2465. Let's break this down into the very short term to see the price action.
Ethereum 30 Minute Chart
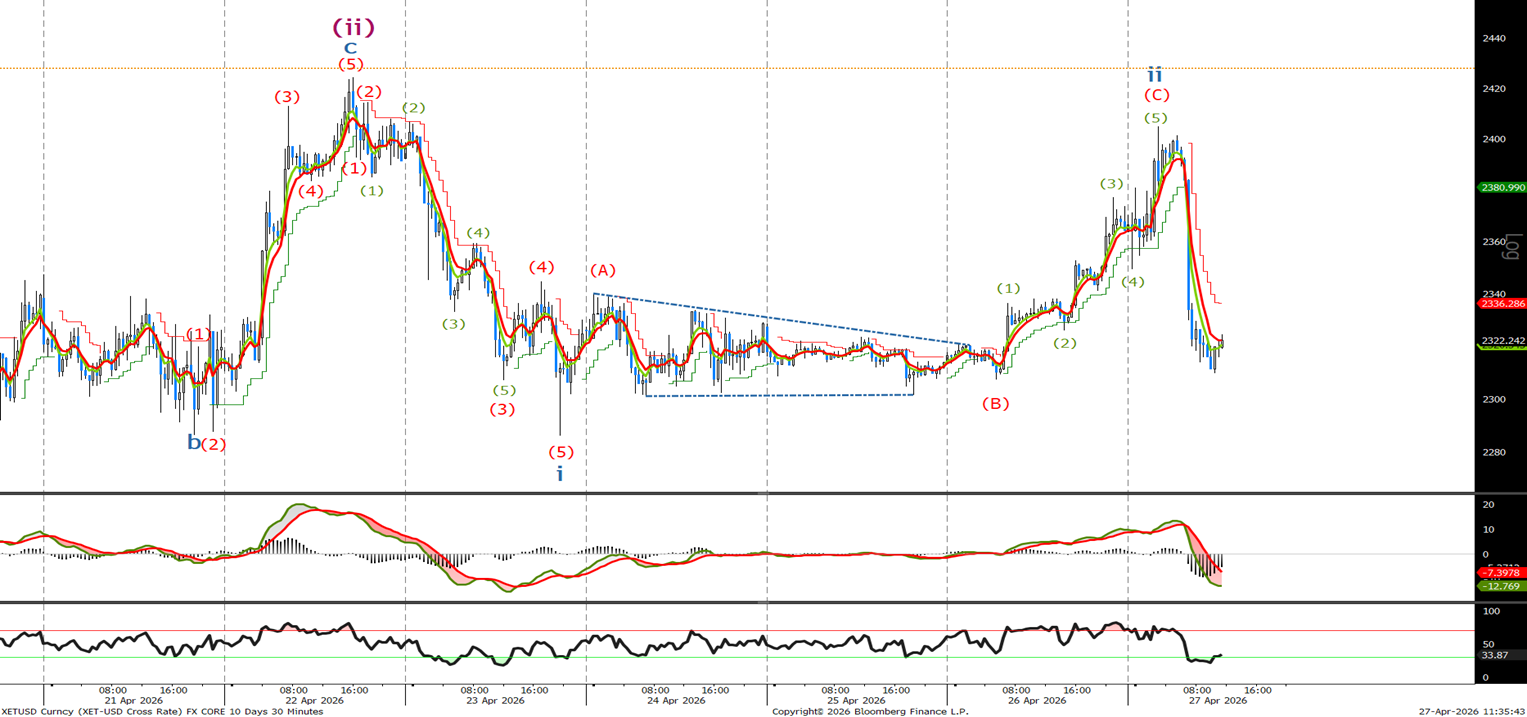
If we look at the very short-term chart, I can count 5 wavers up to complete wave (c) of the correction. A wave iii of a wave (iii) is usually the most impulsive and the sell-off, since the highs add weight to the view. Looking to sell now or any intraday rally, but I am happy to be short with stops previously discussed.
