
Bitcoin Weekly Chart
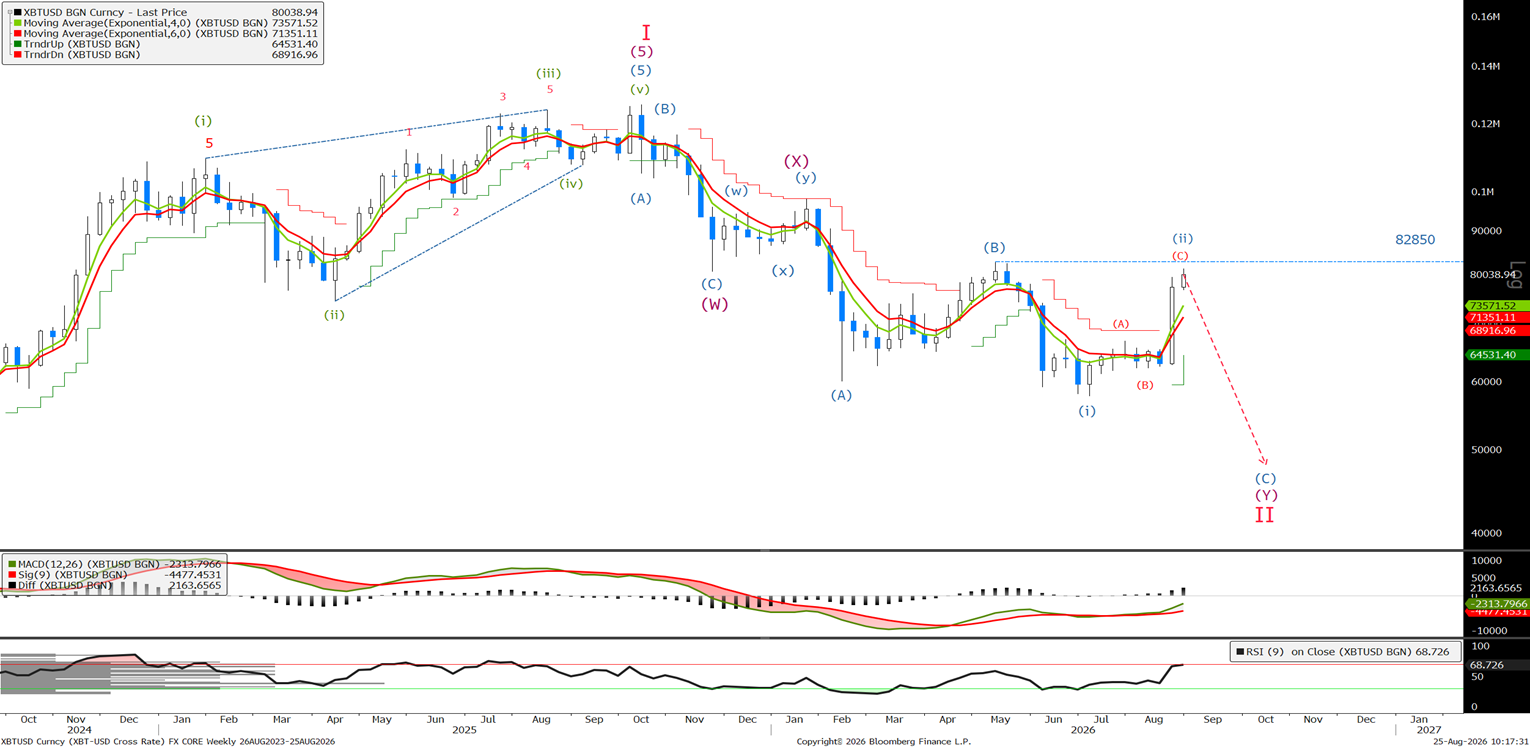
The limit for wave (ii) is 82850 , lets look to the short term to see how far along we are in wave © and if it looks like ending before 82850.
Bitcoin Daily Chart
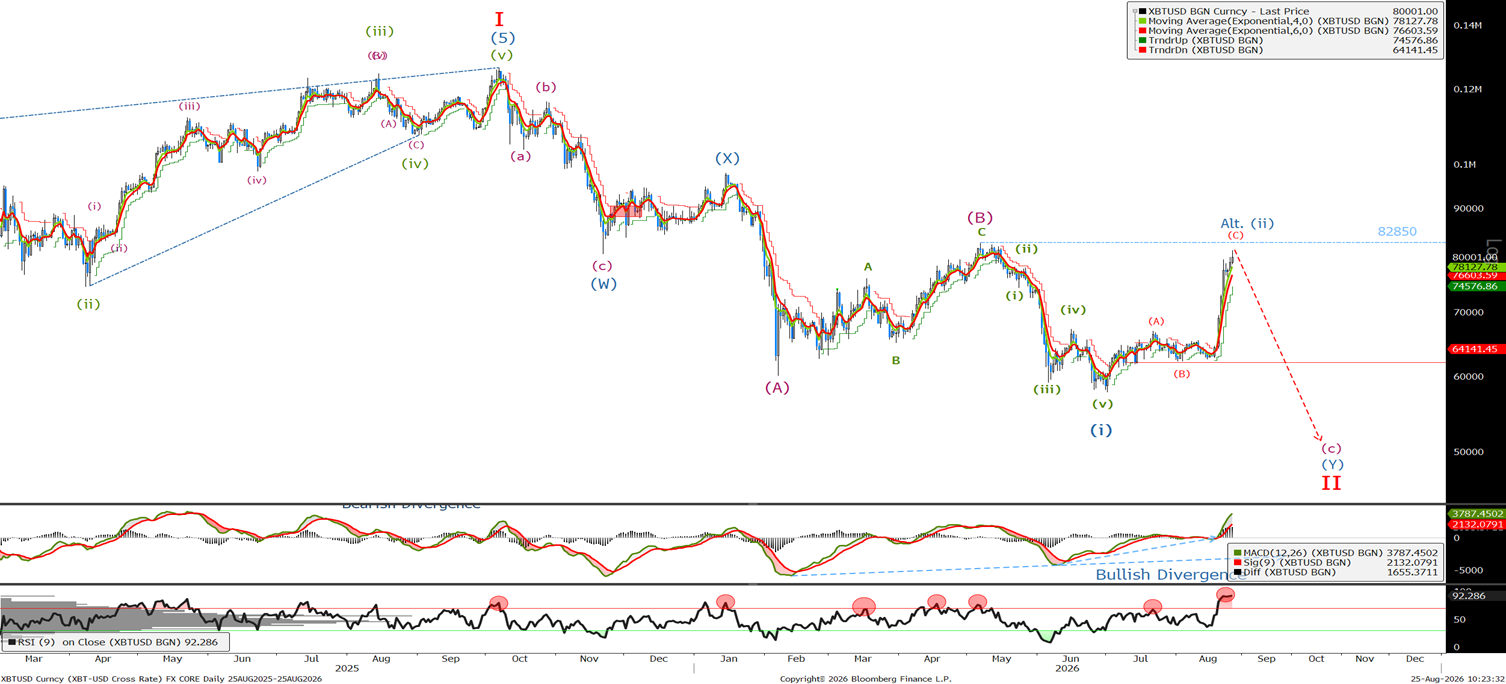
Last Monday we said' A move above 66923 doesn't negate our bearish view, and we will look to sell approaching the 50% retrace level at 70274.we await an acceleration to the downside. A daily close below 62k should confirm that wave (iii) is underway.’ We blew through that level and are approaching the 100% retrace level at 82850. We are currently trading at 80150 so I am selling now with stops above 82850.
Bitcoin Short Term Chart
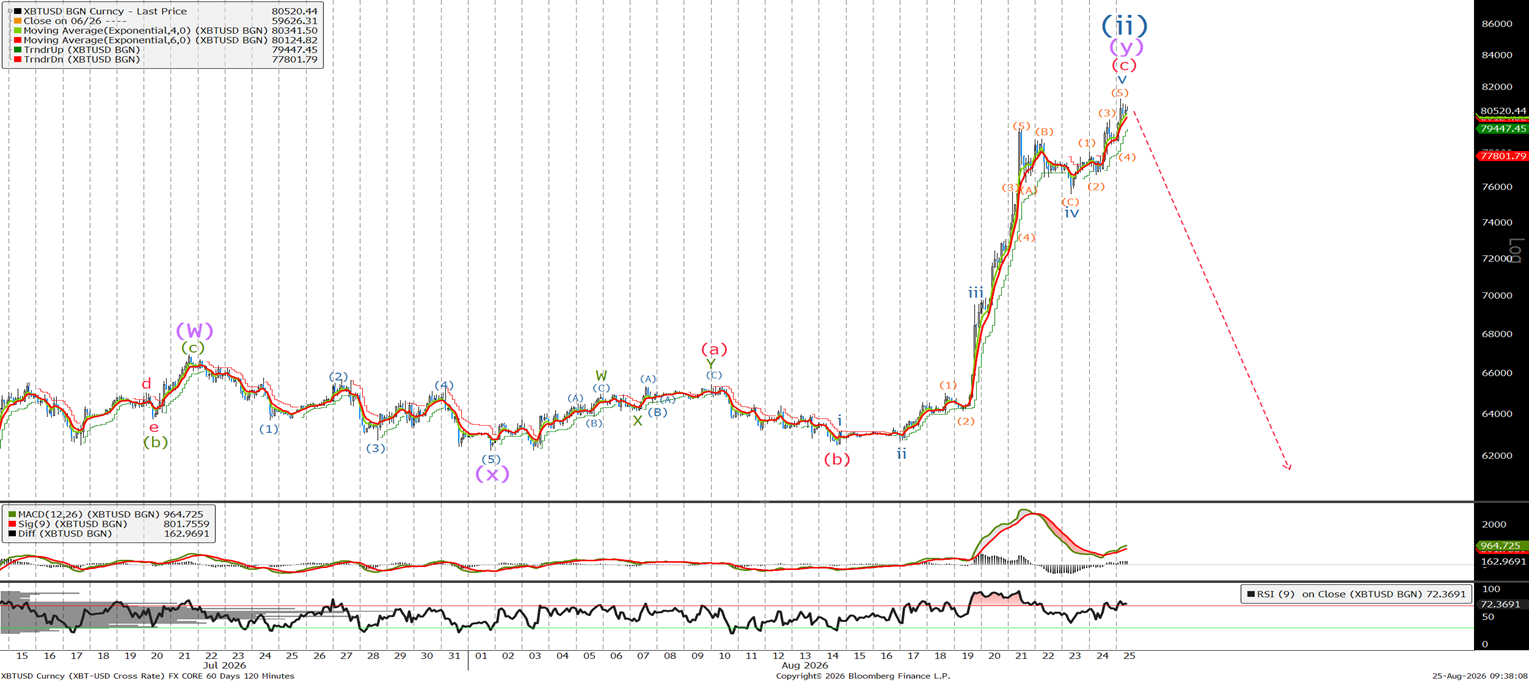
We got stopped out at 65439 and have traded as high as 81257. Looking at the 2-hour chart, I can count 5 waves higher, so I believe we have seen a top and, on a risk-reward basis, if correct, would make at least 20k. So sell now at 80200 with stops at 82850. Or sell on confirmation with a 2-hour close below 78450 placing stop above 82850 or the most recent high.
Ethereum Long Term Chart
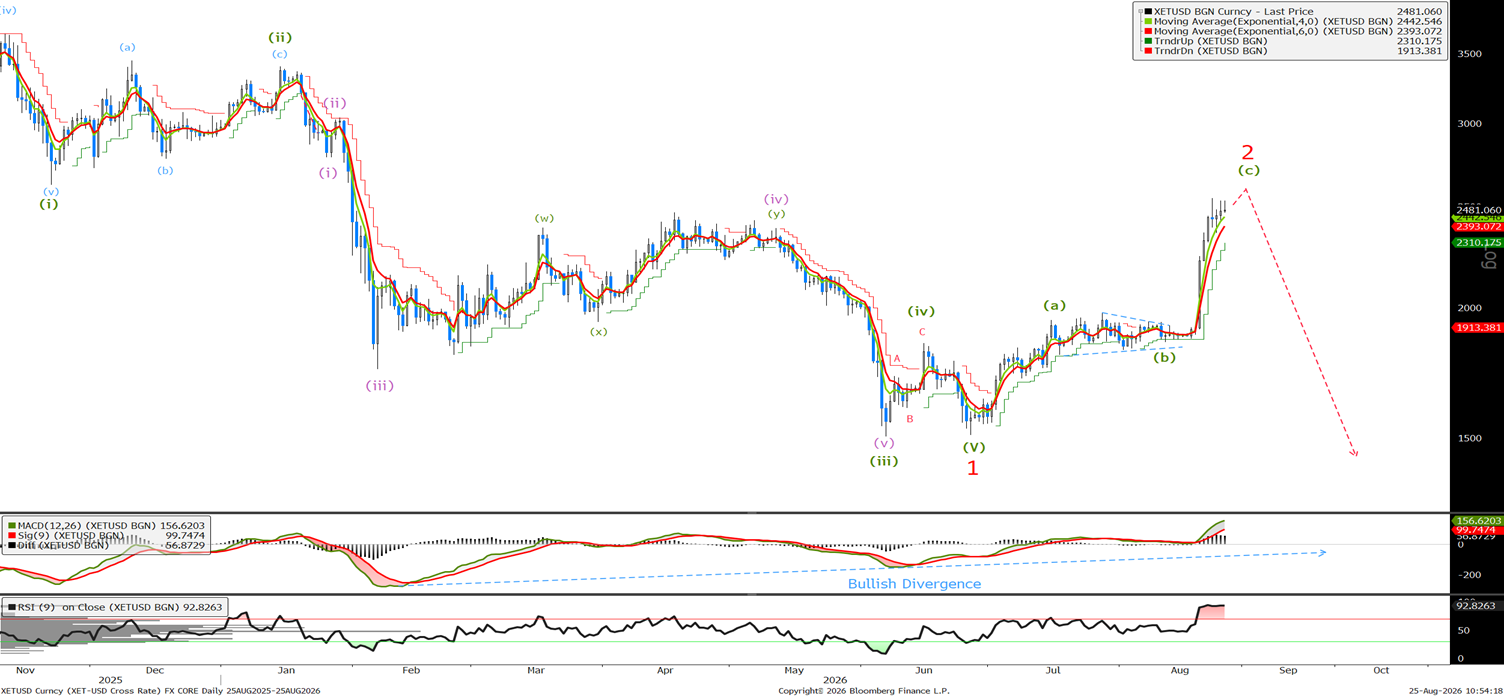
Last week we said, ‘We need to stay below the wave (iv) high at 1980. A break will signal a target correction towards 2200. ‘ We have actually traded so far as high as 2546. I have adjusted the wave count to take account of this recent rally, but we will have to look to the short term chart to see how far along in wave (c) we are.
Ethereum Short Term Chart
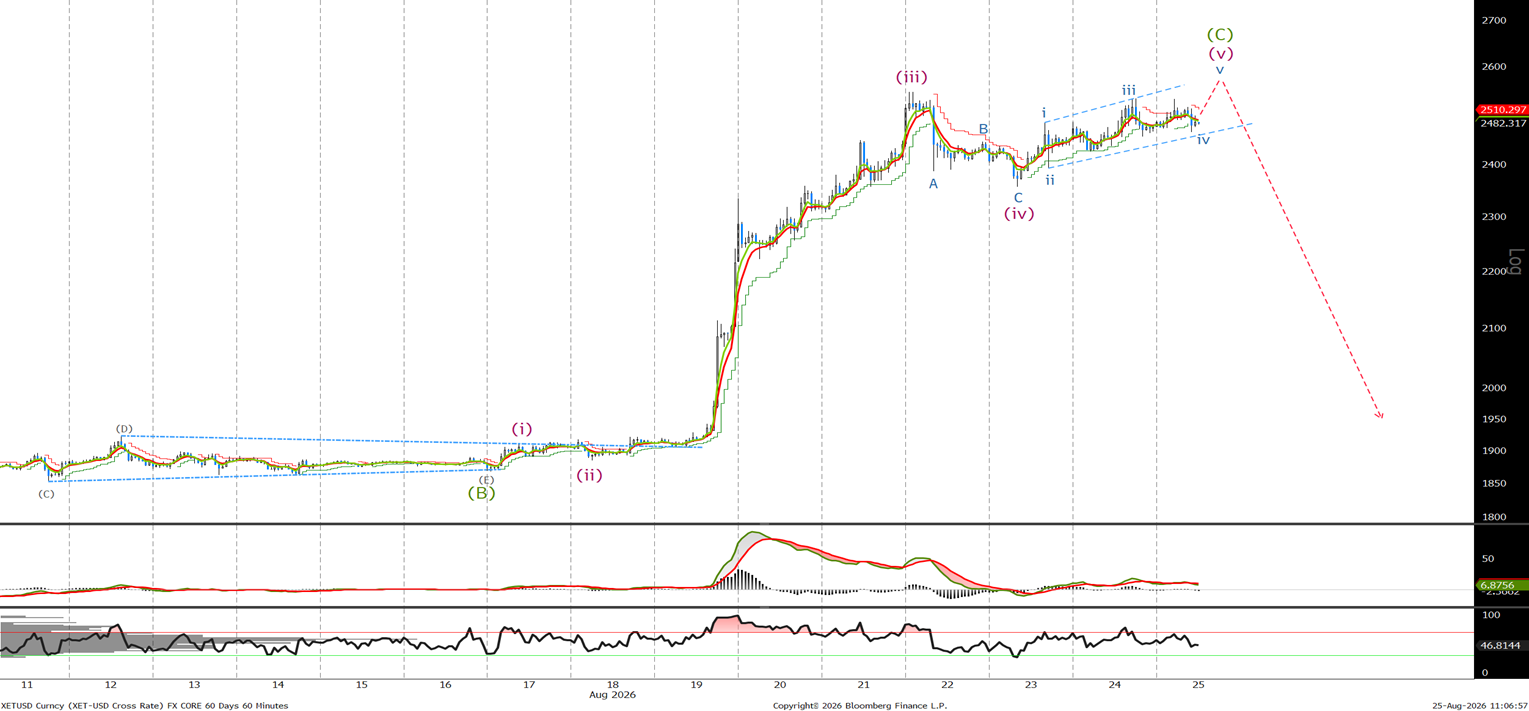
Last time we said, ‘For a short-term trade, buy now at 1890 with a stop at 1850. Look to take profit and go short above 1940 with stops at 1980’ We made a whole 20 bucks. At least we weren’t short all the way to the current 2531 high. Breaking down the hourly chart, I believe we have one new high to make above 2531 before the sell-off resumes. Given the divergence in the MACD I will look to sell up there and add on a confirmation that a top is in place on an hourly close below 2350, placing stops above the last high.