Bitcoin Long Term Chart
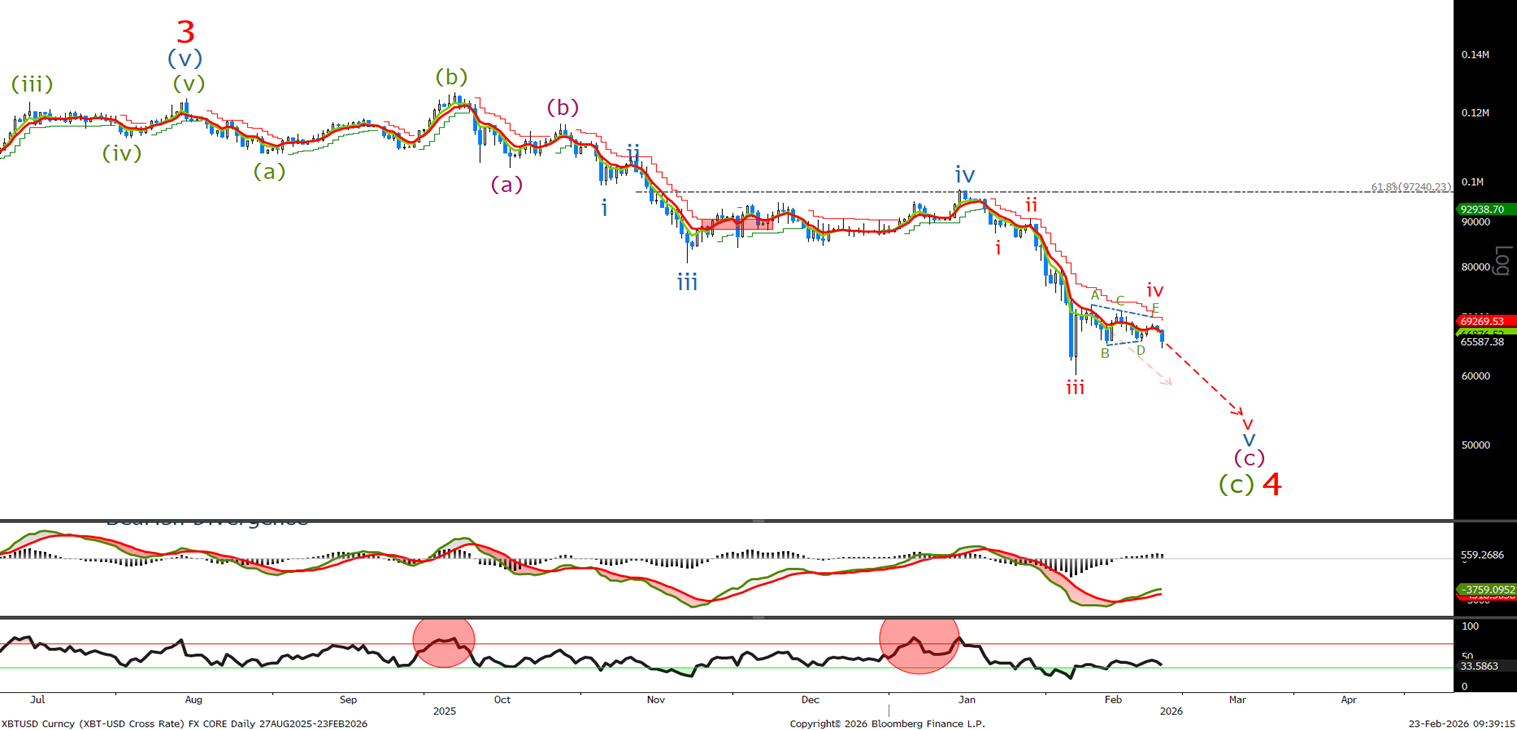
Last time we said ‘Looking for 5 waves lower in wave v of v to complete the larger wave 4 correction.’ We range traded in what I am now calling a wave iv triangle correction. This morning's break of the wave B low confirms that the final 5 waves lower are underway.
Bitcoin Short Term Chart
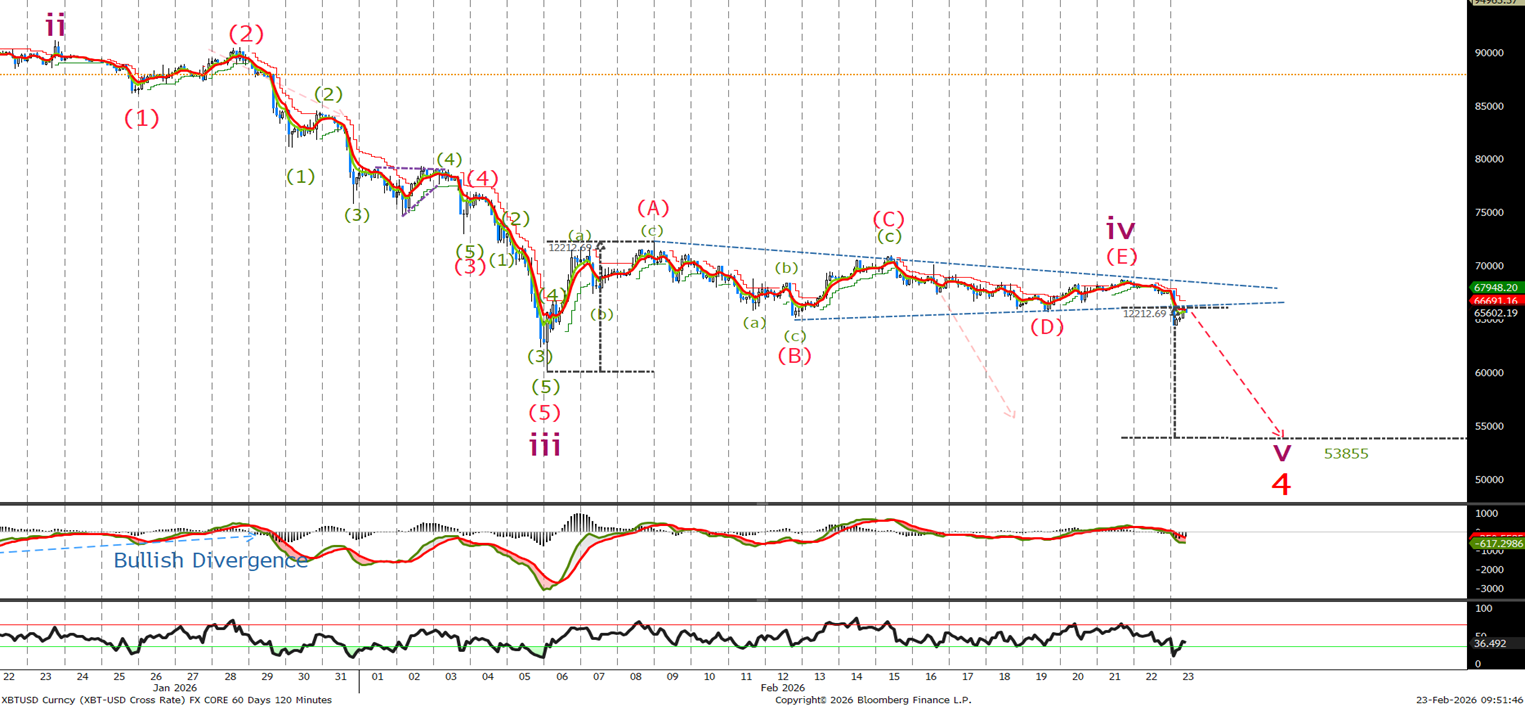
I have redone the short-term chart which clearly shows the corrective price action of the last couple of weeks. The overnight break lower now targets 53855. Wave IV triangles often travel the same distance as the depth of the triangle on breakout. We will look for a sell-off in 5 waves towards that level, followed by a test of the 50k level depending on the strength of the upcoming sell-off. This will provide us with an excellent buying opportunity, and I will update the short-term view when we get there.
Ethereum Long Term Chart
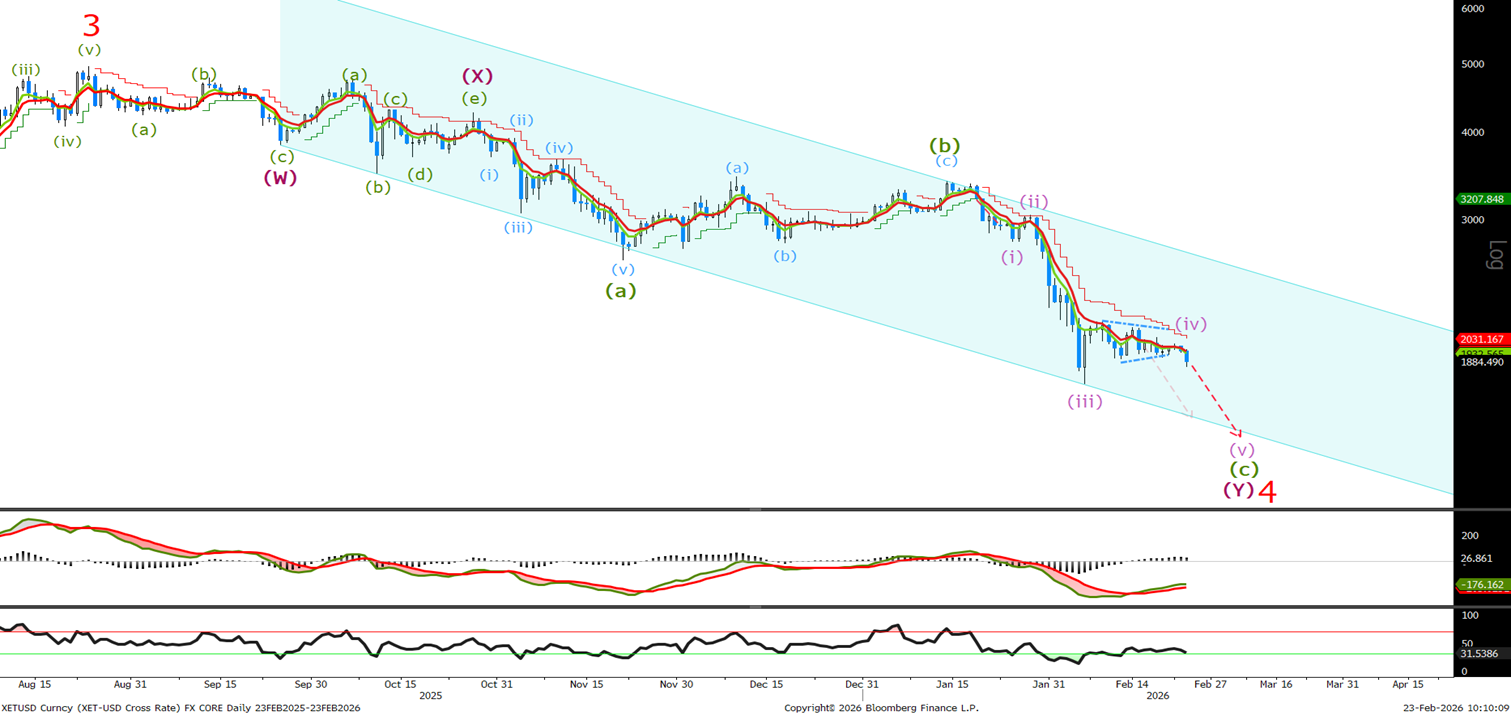
Like Bitcoin, the end of the wave (iv) correction appears to be over, with this mornings sell off and break out of the triangle confirming that the final legs lower are underway. Lets look to the short-term chart to see the target levels to the downside.
Ethereum Short Term Chart
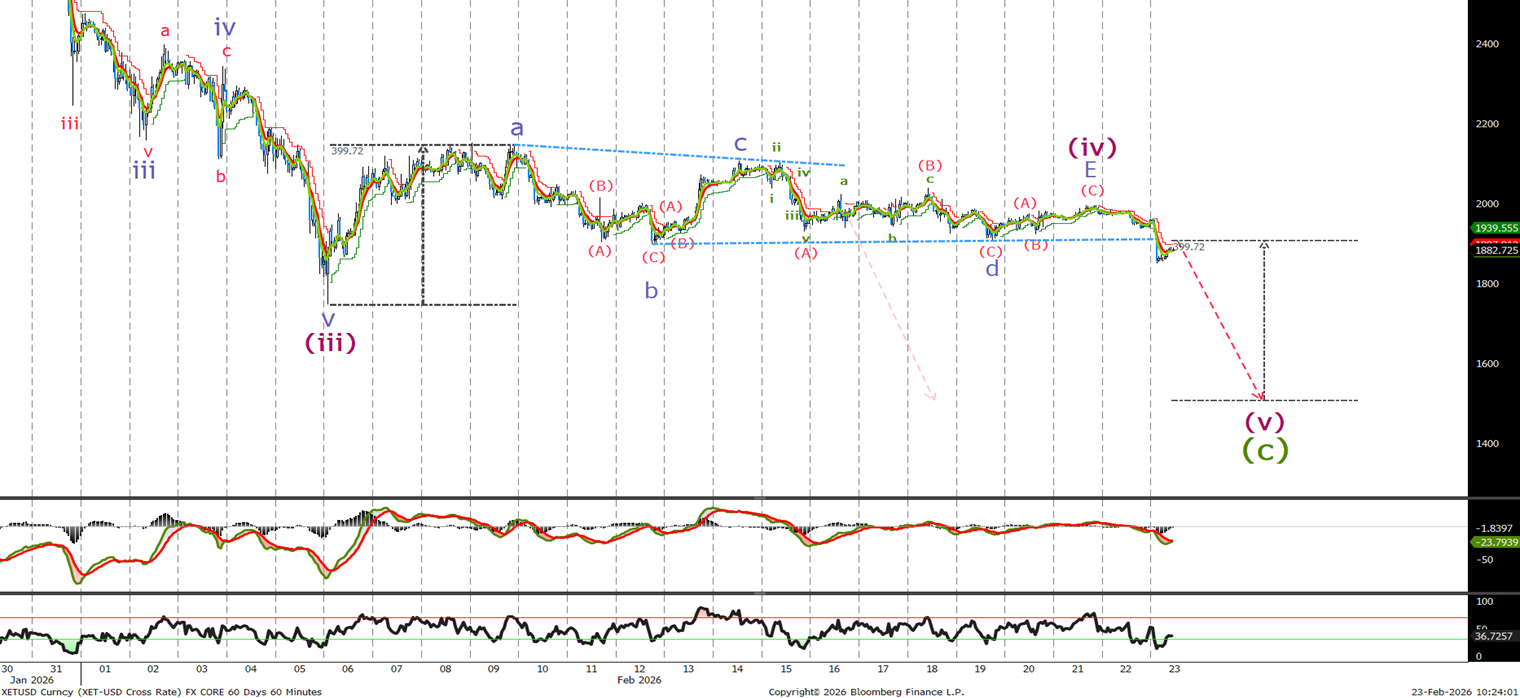
Last time I said ‘A move below 1900, the wave i low should see an acceleration below 1750 towards the 1600 level.’ We traded sideways instead of selling off , giving us a clear wave (iv) triangle correction. We actually traded to 1906 , completing wave d and only broke the 1900 level this morning. This gives us a target to complete wave (v) at 1506.
