Bitcoin Long Term Chart
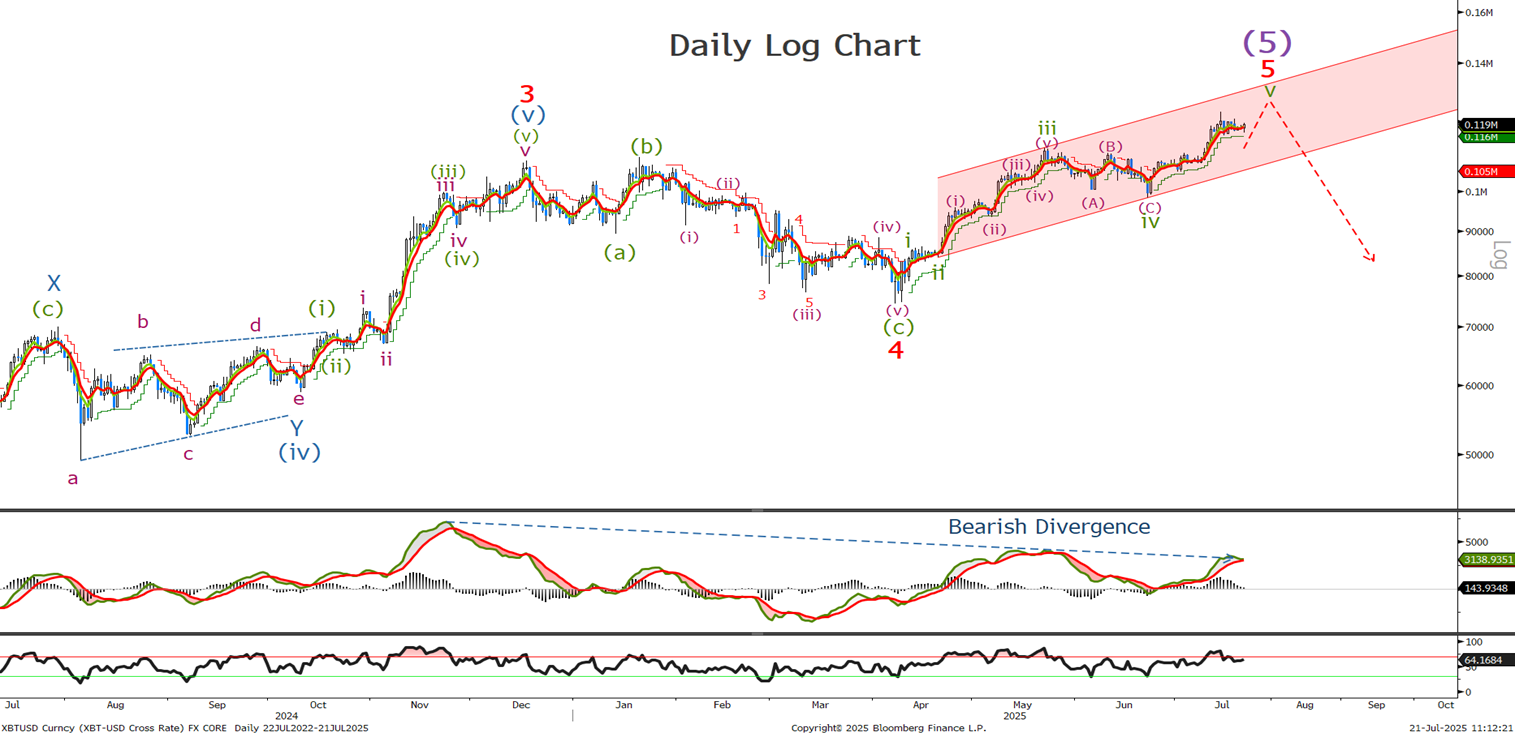
We are looking for BTC to continue higher over the coming weeks. Possible correction currently underway. Lets look to short term chart to see where the buying opportunities are.
Bitcoin Short Term Chart
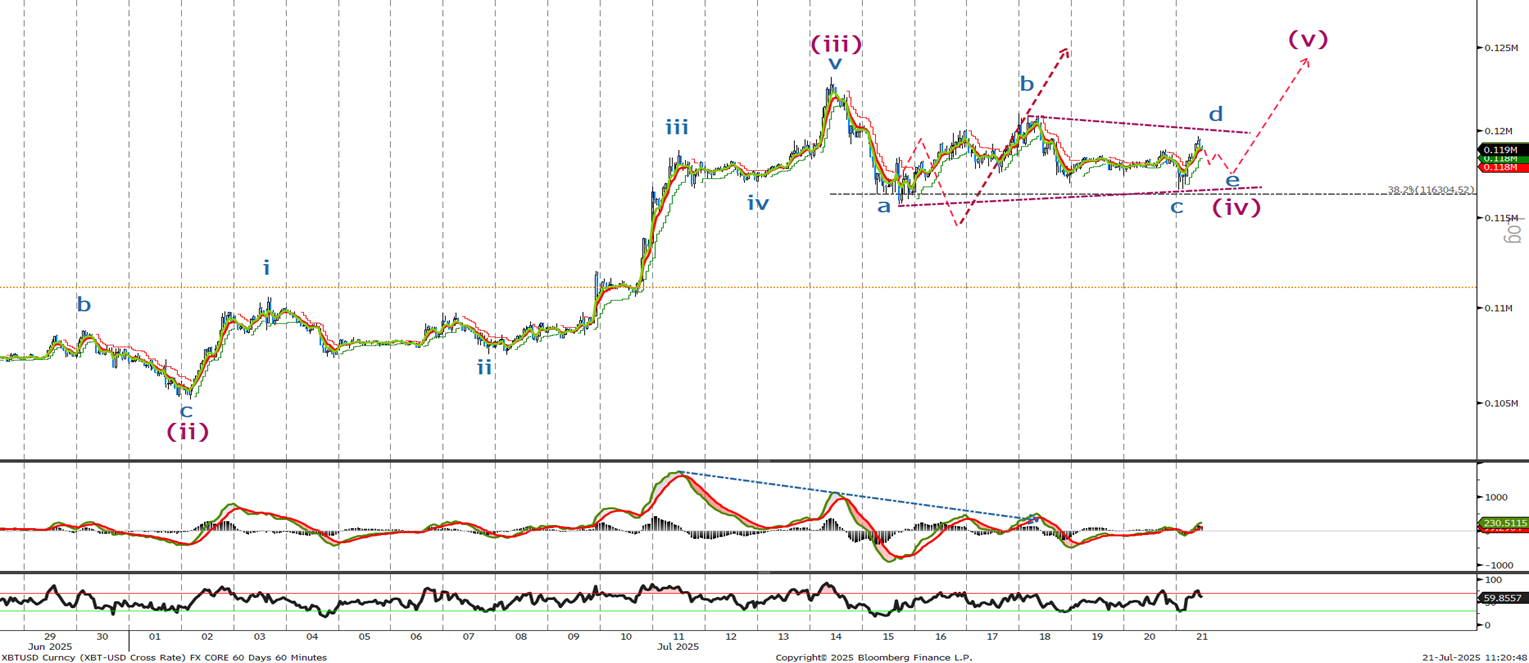
Last time I said ‘I believe we have completed 3 waves of the 5 higher and are tracing out a wave (iv) correction that should take us down towards 114k. In 3 waves. From there I would look to trade higher in 5 waves to new highs.’ We were close but instead of a zigzag we are tracing out a triangle correction that should not break the 115736 wave a low before what should be the final leg higher towards 140k. Where are we in this triangle correction.
Bitcoin 30 minutes Chart
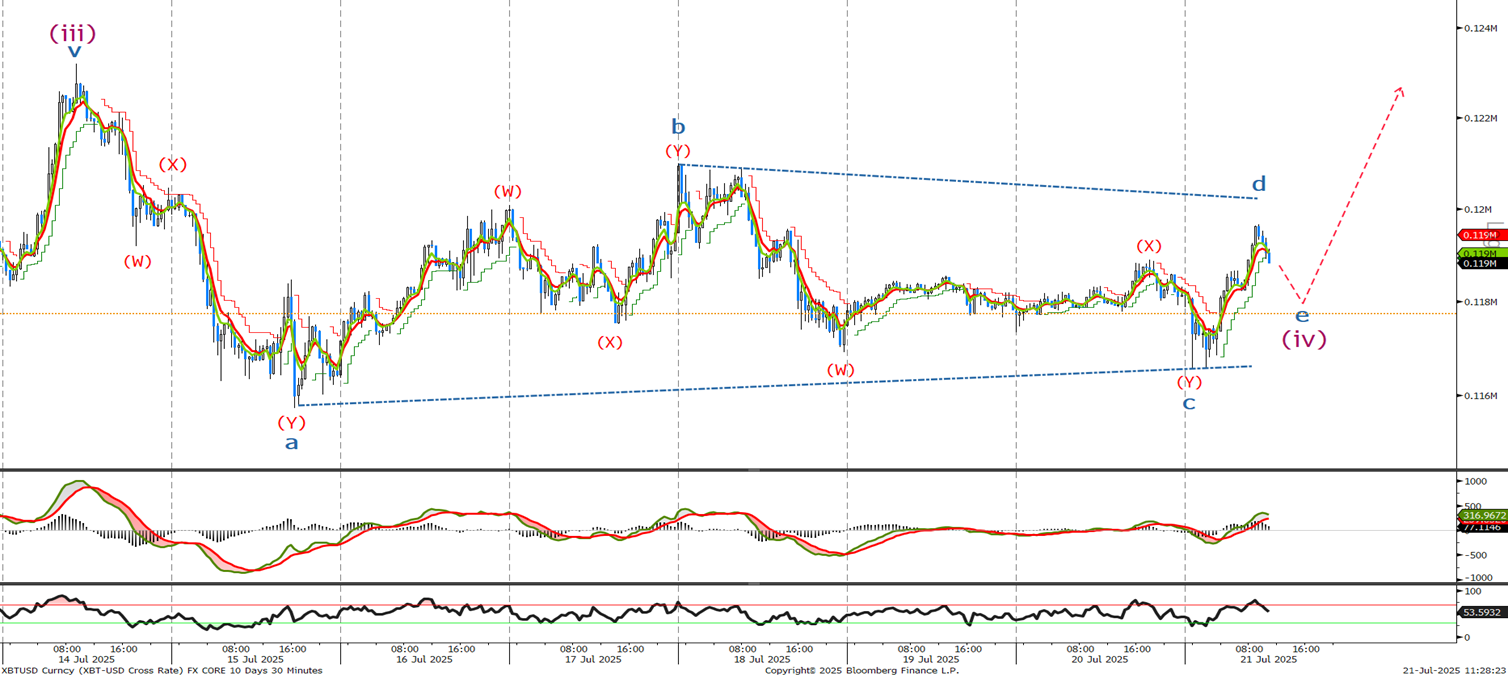
It looks in the very short term that we should trade slightly lower before completing the minor wave (iv) triangle correction. Look to add to longs around the 114k level before trading higher and breaking out of the triangle in 5 waves higher to new all time highs. A break of the wave b high at 121k will confirm that wave (v) is underway.
Ethereum long Term Chart
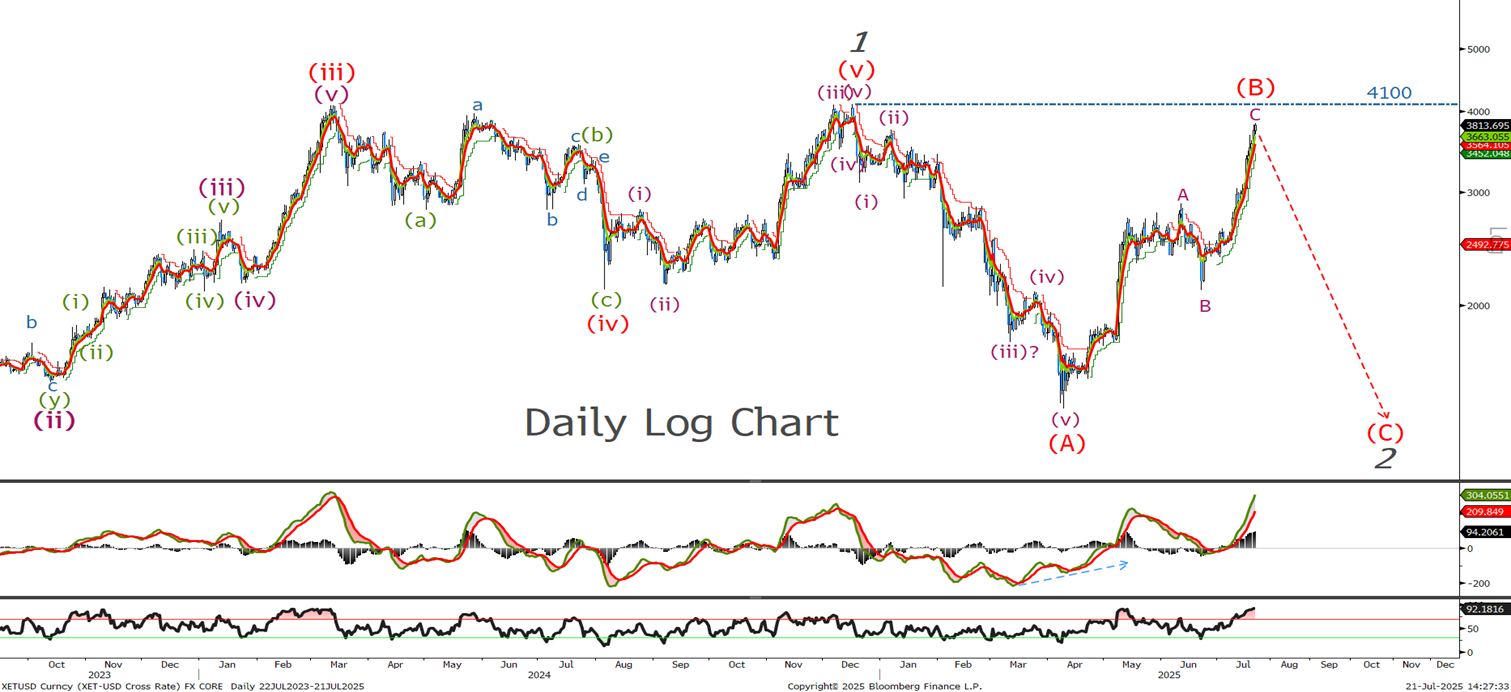
Last time we said ‘it appears that we are approaching extreme levels in a wave (B) correction which should end around the 76.4% area . A daily close below 2820 will be the first signal that wave © lower is underway. Despite expecting lower whilst below the below the 4120 high lets look to the short term chart to see where we are in the price cycle.’ We are even higher than last week but remain bearish until 4120 breaks which will negate this view.
Ethereum 60 minute Chart
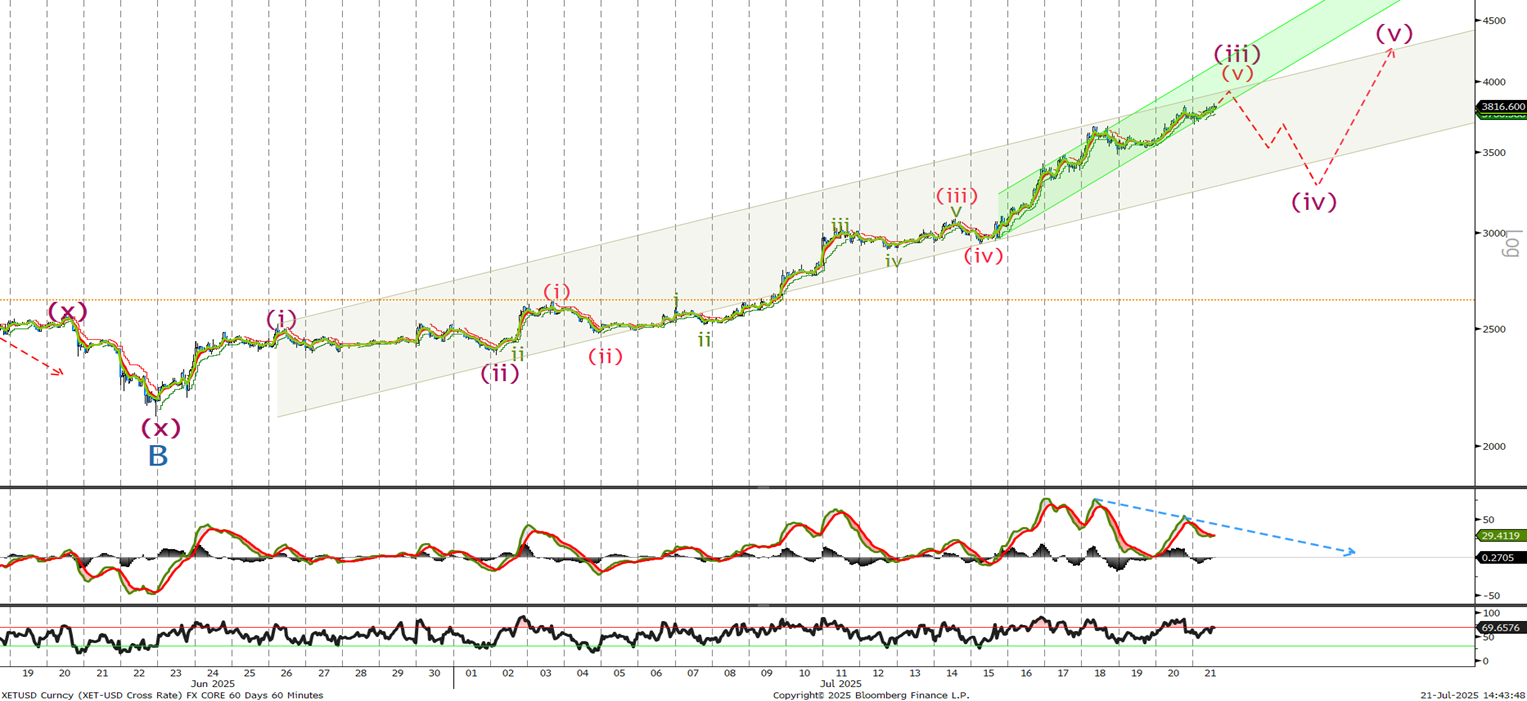
As last week we are ‘Looking at the hourly chart we are waiting for wave (v) of (iii) to complete before a correction towards the 3000 level in a larger correction. This will enable us to rebuy lower’. No change as momentum starts to drop , highlighted by the MACD and the downwards sloping blue arrow. Look to buy around 3400 and again at 3160. A break of the 2500 level will confirm that wave 3 is underway.
Ethereum 30 minute Chart
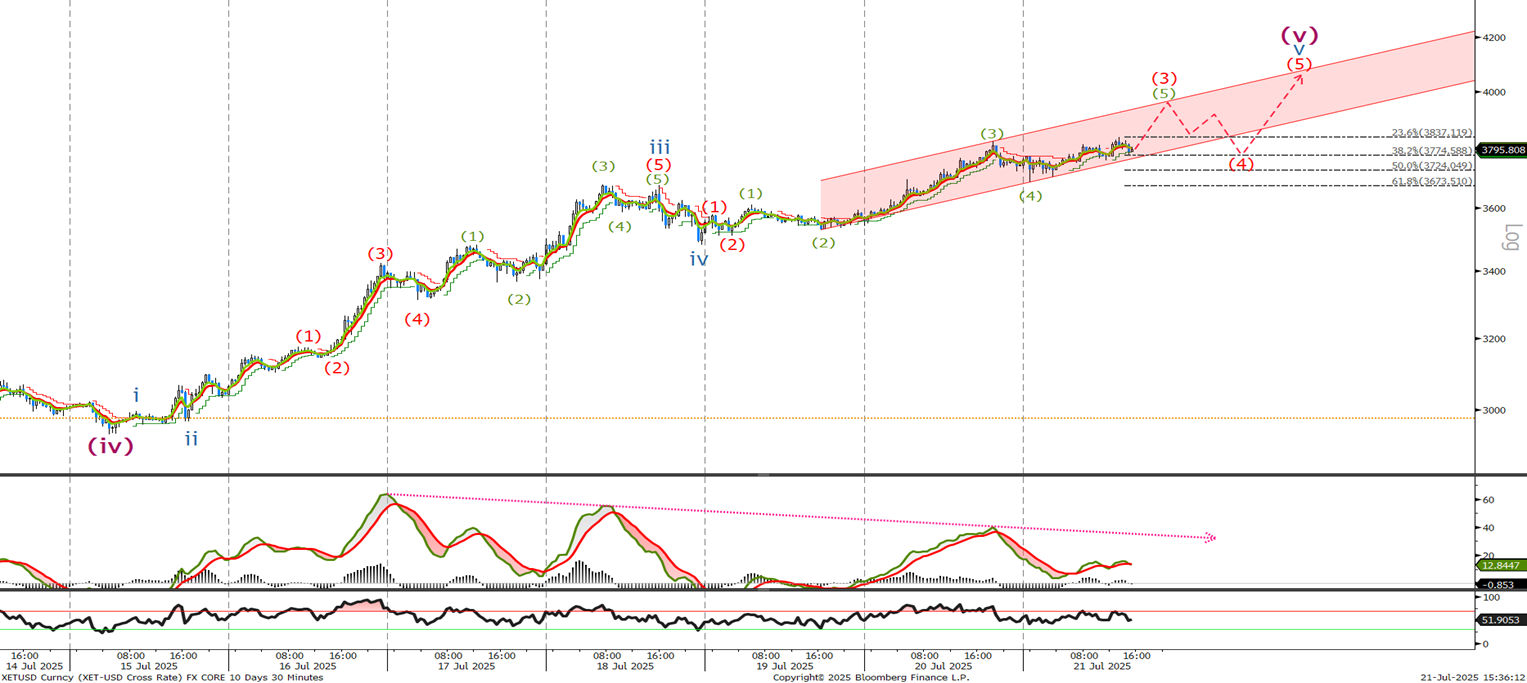
Breaking the final wave (v) in wave C down it appears to me that we have further to go and would use any pull back intot the 3670-3770 area for a final push that should end below 4120. If I am wrong and we break the 4120 we will already be long from buying on what should be an upcoming wave (iv) correction. Given the divergence and lack of momentum in the MACD I expect to see a sell off in the next few days.