
Bitcoin Weekly Chart
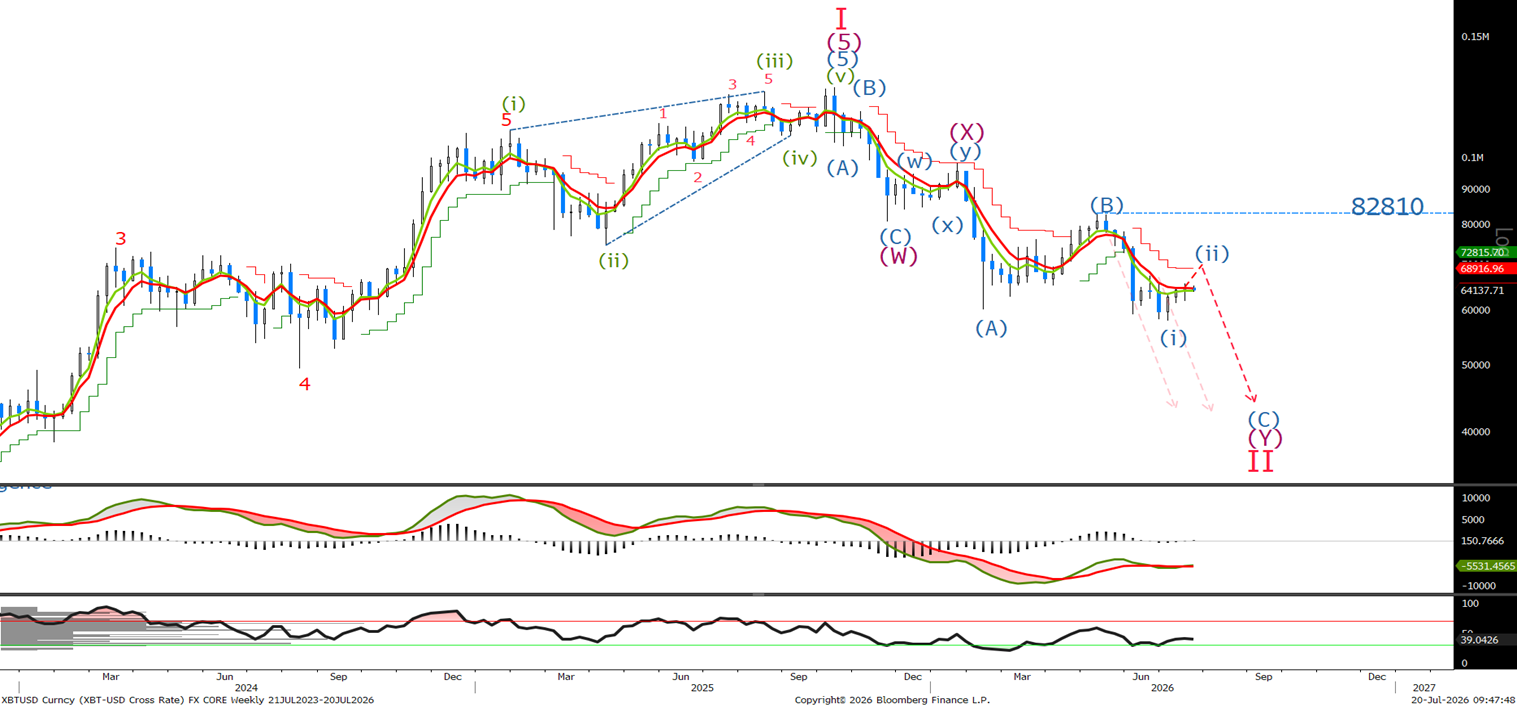
No change in the weekly view ‘I believe we could see a rally in a corrective wave (ii) before the long-term bearish trend reasserts itself. at least for a few days, I am looking for the BTC to trade higher. Nothing in the long term has changed I do not expect 82810 to be tested.’
Bitcoin Daily Chart
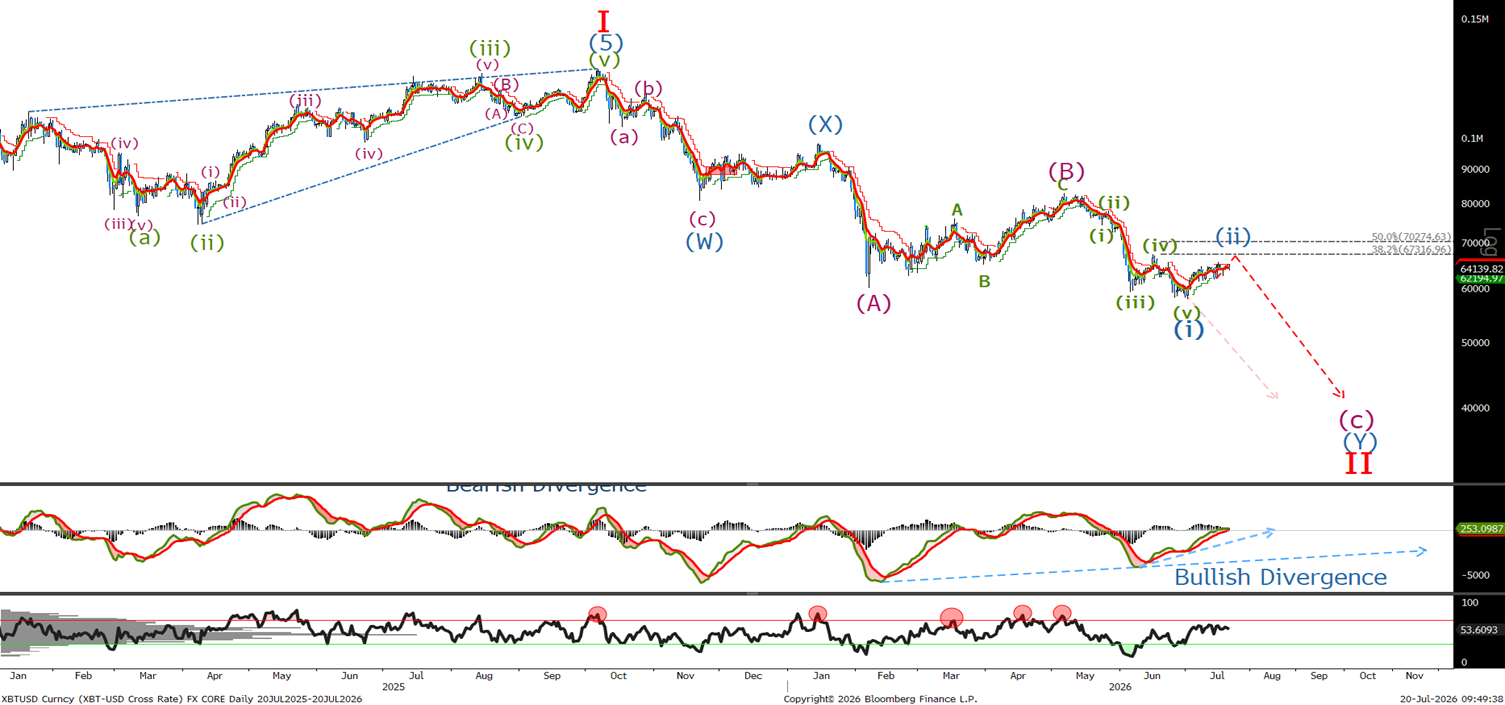
Last week we were looking for ‘a 3-wave correction into the 67.3k to 70.3k area. I would look to sell up there. A break below last week's low at 57742 would signal the correction is over.’ No change in the view , we need to look at the short-term chart to breakdown the wave (ii) correction.
Bitcoin Short Term Chart
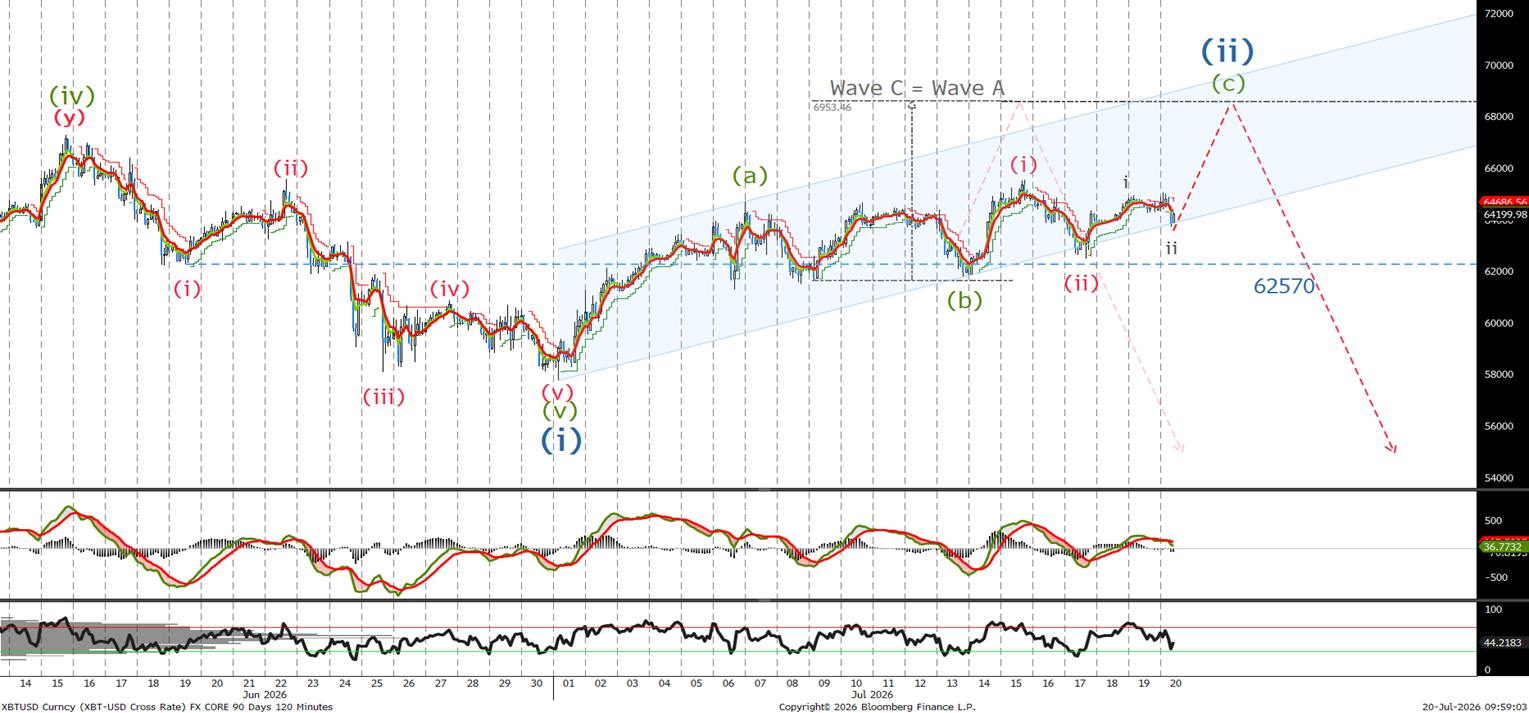
Last time I was looking 'for a slight new high followed by a correction in wave (b) before a final push to test the 67315 area. This was the area of the previous wave (iv) and also the 38.2% retrace level. Wave (c) will be equal in length to the wave (a) just above 68582. I expect to see the BTC rally at any moment, if not long, buy now at 63k with a stop below 61k. Looking to sell at the above-mentioned levels.' It appears that wave (b) is now complete, and I am expecting to see the BTC burst higher, leave stops at 61k.
Ethereum Long Term Chart
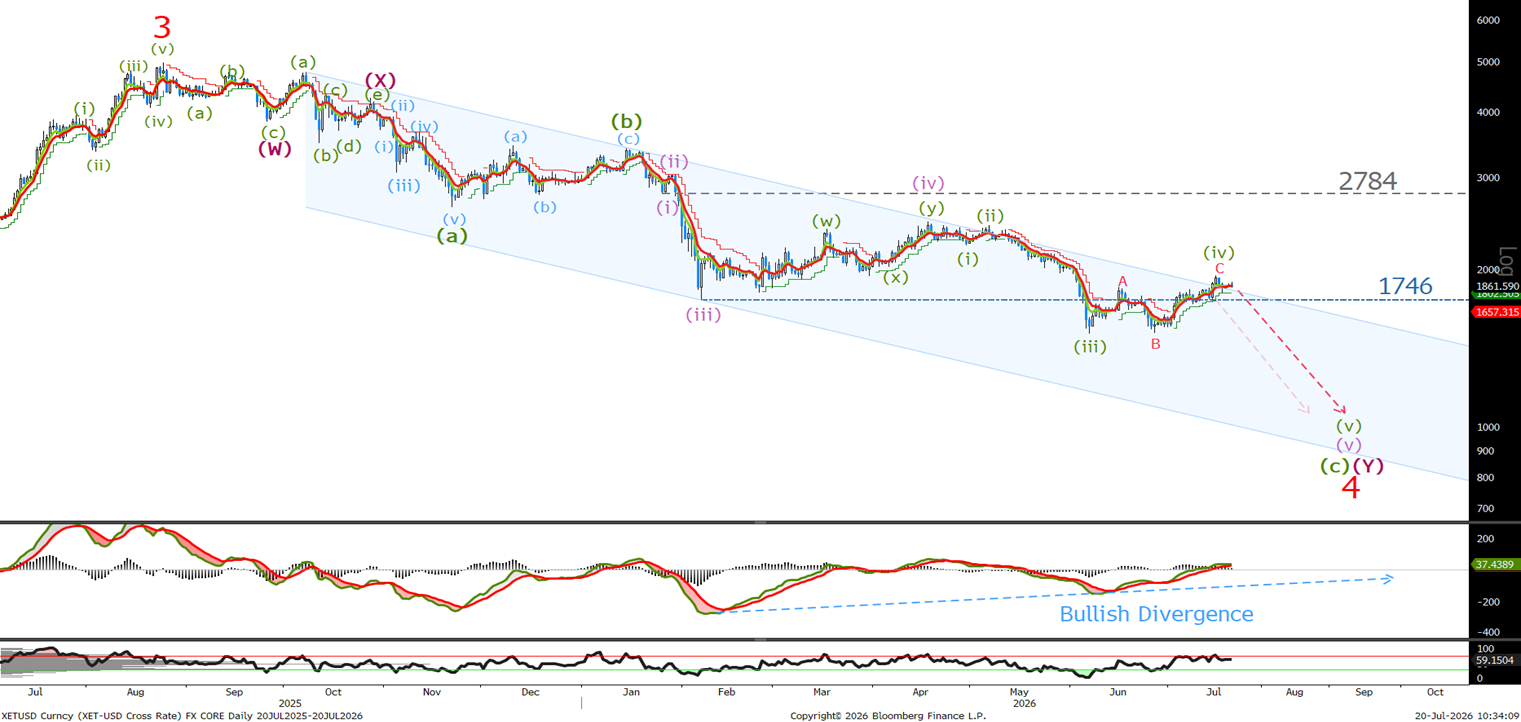
Last week I said, ‘If we trade above wave A, the correction will take the form of a standard zigzag correction. As you will see in the short-term chart, we have completed 5 waves up, so I am calling the correction over, and I am looking for lower.' We broke above wave A, so let's look again at the short term to see if the wave (iv) correction is over.
Ethereum Short Term Chart
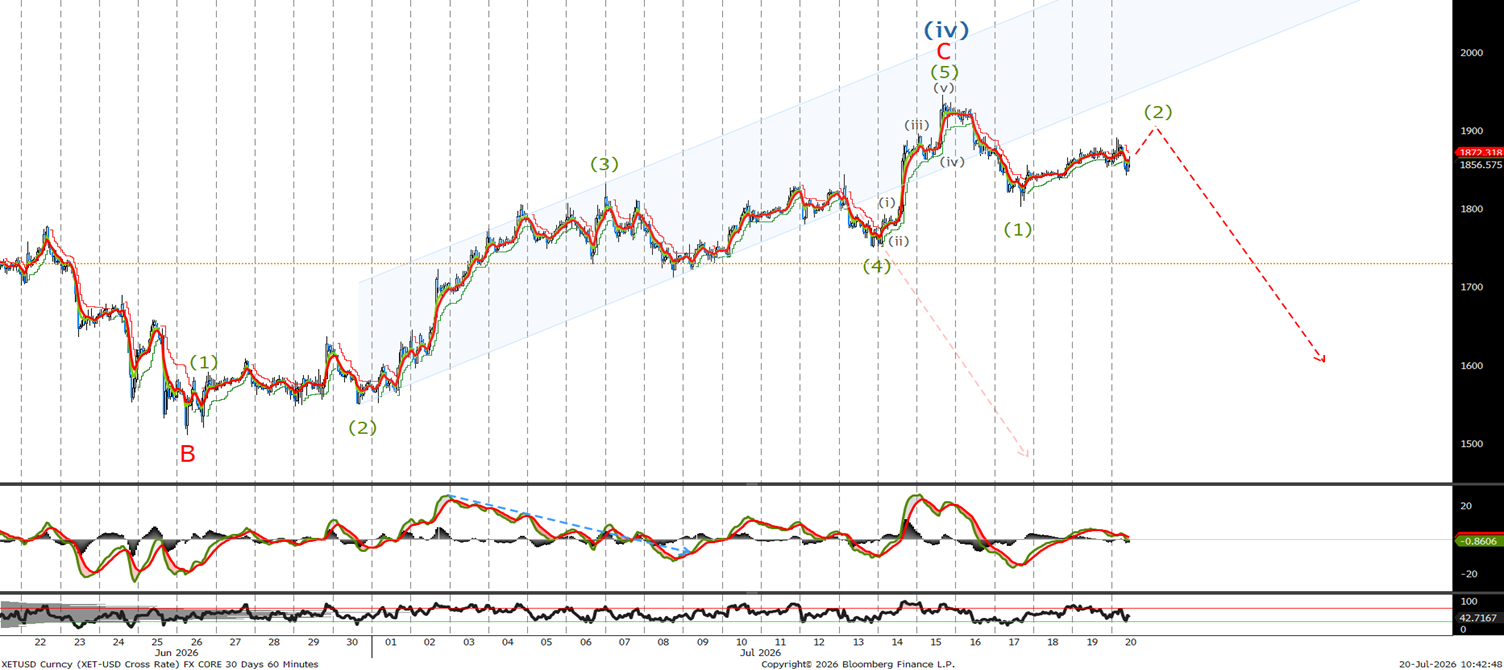
Last time we said, ‘Theoretically, I would have preferred the wave (c) to have traded slightly higher, but given I can count 5 waves higher and as yet haven’t broken 1850, remain short with stops remaining at 1850.’ We got stopped, and I have relabeled the wave count, which if correct should see the ETH sell off in 5 waves whilst below 1947. I am looking to sell at 1900 with stops above 1950 or on a break below the wave (1) at 1803.
Ethereum Very Short Term Chart
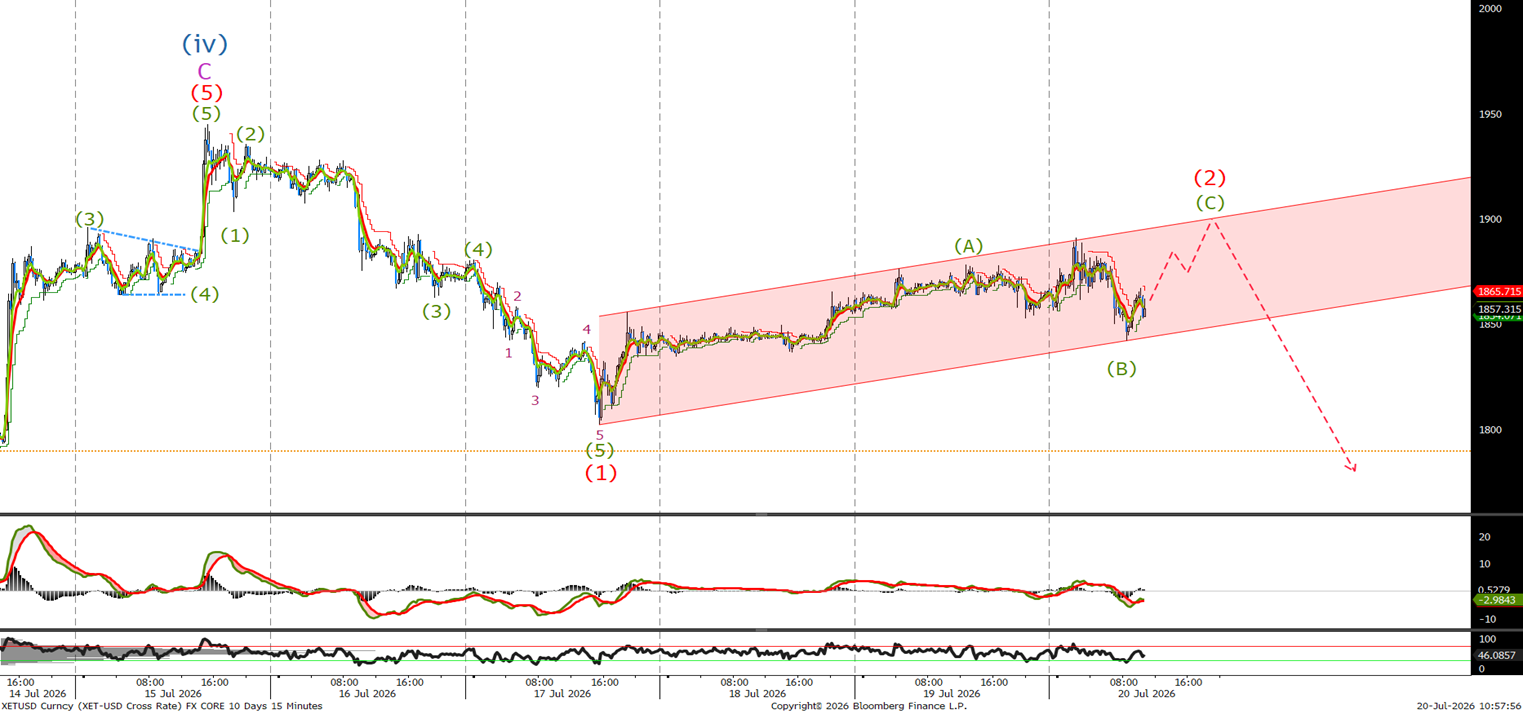
I am showing the 15-minute chart again to highlight 5 waves completed for (1) of (5). If correct, we should see a slightly higher before the sell-off continues, with a break below 1846 being the first signal a top maybe in place for wave (2).