
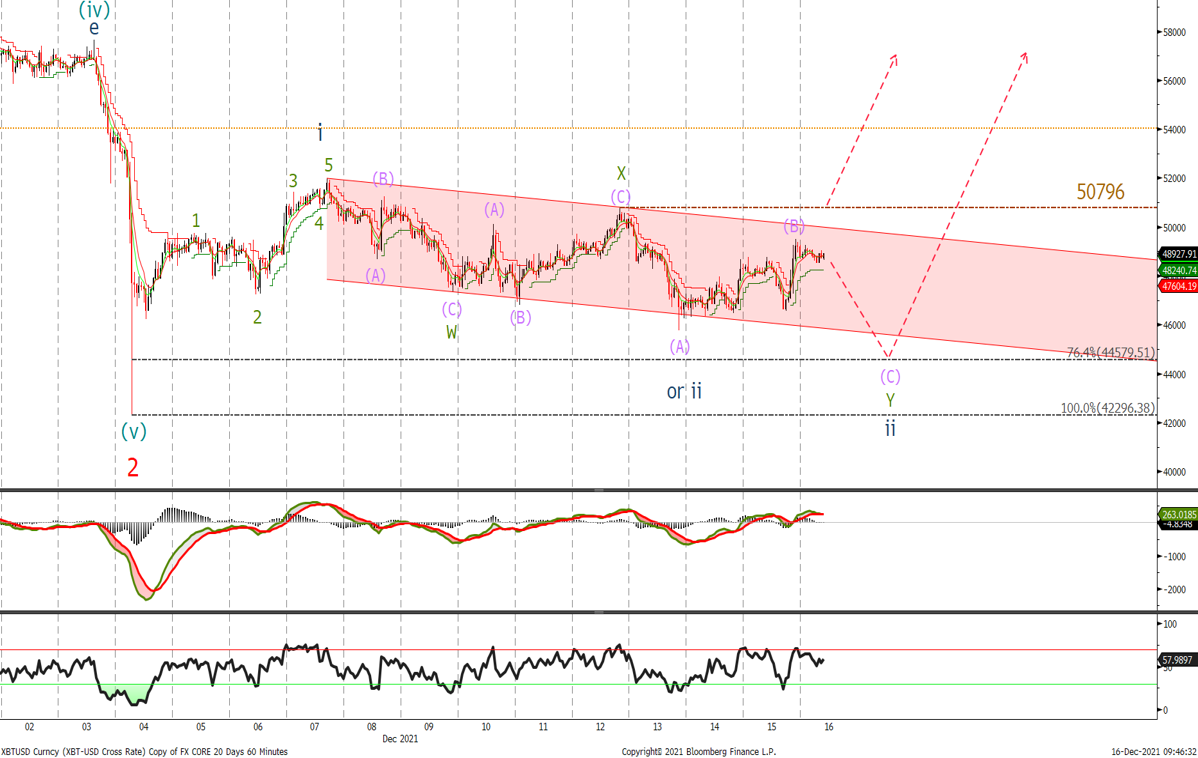
Bitcoin
The low from the crash earlier this month is still in place and although it is possible that we have already completed the wave ii, until we close above $50'796 on an hourly basis, we will allow for another sell off from current levels. Would look to buy around the bottom of the channel and the 76.4% retracement level at $44'579 with stops below the wave 2 low at $42'296.
Once the zigzag correction is complete we will be looking for an acceleration higher and a test back to the $57'600 level. Long term we're still happy to hold and accumulate BTC on dips.
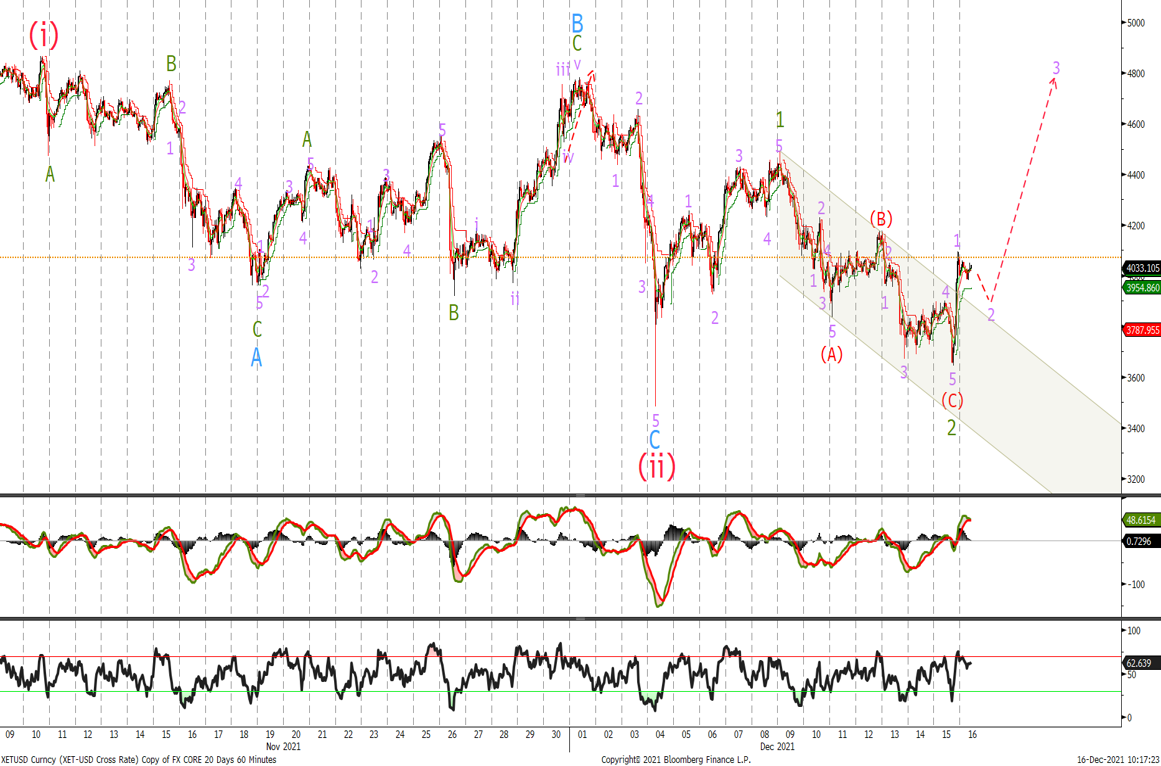
Ethereum
Last time we said:
‘A move above $4'460 should confirm wave (iii) higher and we are looking for an acceleration to new highs above $5'000 going into year end. Look to buy on dips with stops at $3'416.
We spiked to $4'485 before selling off again yesterday to $3'644 completing a larger correction than we were expecting. The break out of the channel is the first indication that ETH is starting wave (iii) higher. Look to buy now or slightly lower around the $3'906 level with stops below the wave (ii) low at $3'482. A move back above $4'491 will confirm the move higher with next target situated in the $4'800/$5'000 area.
Written by Matthew Clark
