
Bitcoin Weekly Chart
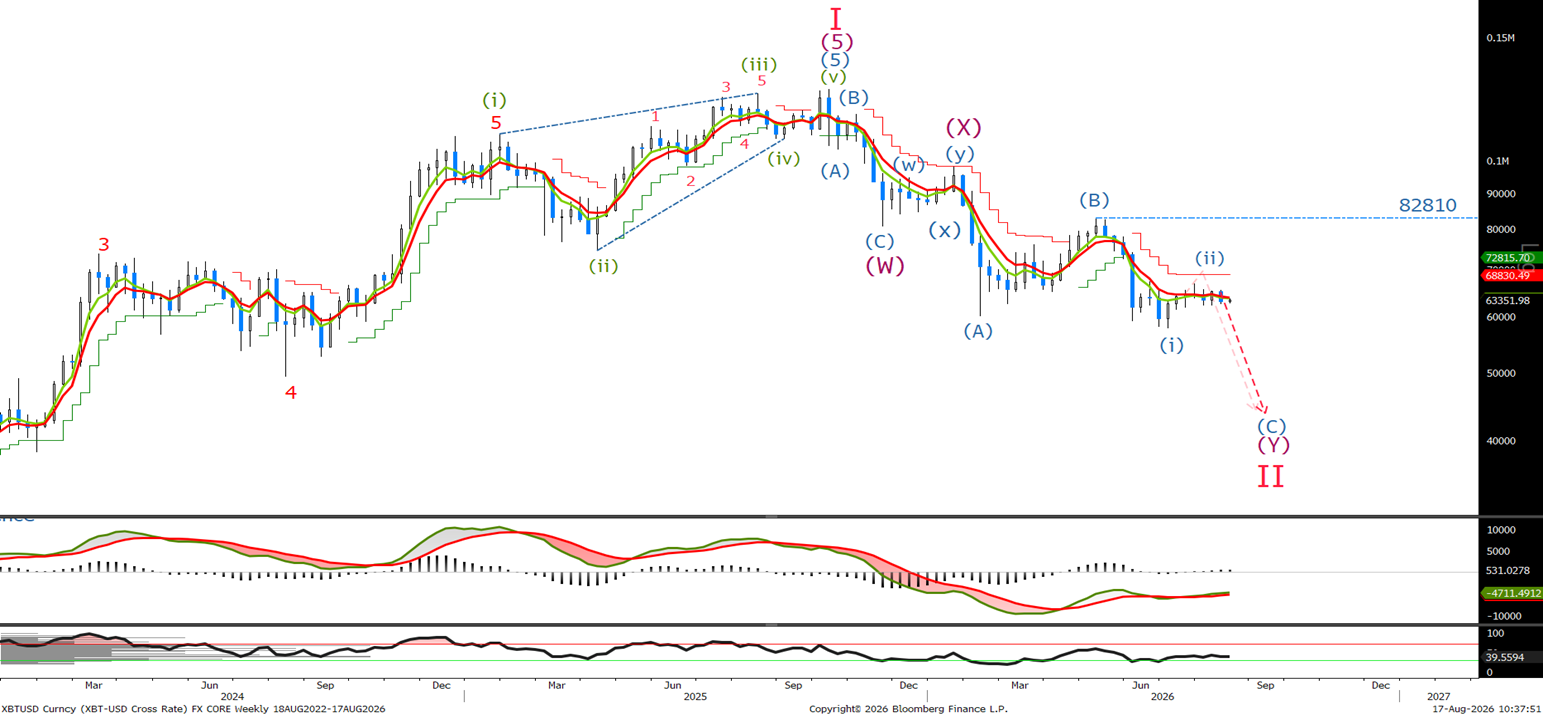
No change on a weekly basis,’whilst below 66923 we will look to sell rallies. A break above will call for a test of the 68900 level, where we will look to sell again .’
Bitcoin Daily Chart
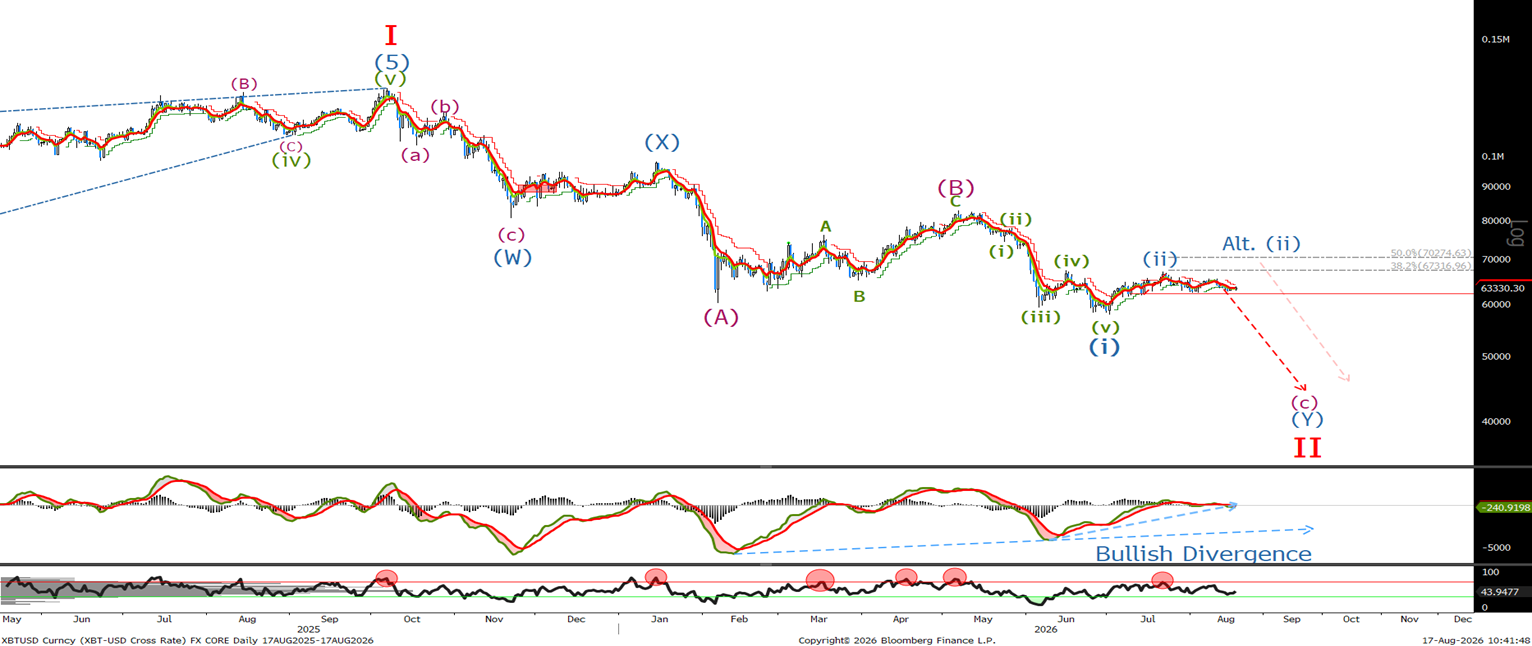
Last Monday we said' on a daily basis, we are looking for a selloff and a daily close below 62k to confirm that wave (iii) is underway. A move above 66923 doesn't negate our bearish view, and we will look to sell approaching the 50% retrace level at 70274.we await an acceleration to the downside. A daily close below 62k should confirm that wave (iii) is underway.' We traded lower in line with expectations, reaching a low on Friday of 62480. Let's look at the short-term chart to see where we are and if we will break this 62k level.
Bitcoin Short Term Chart
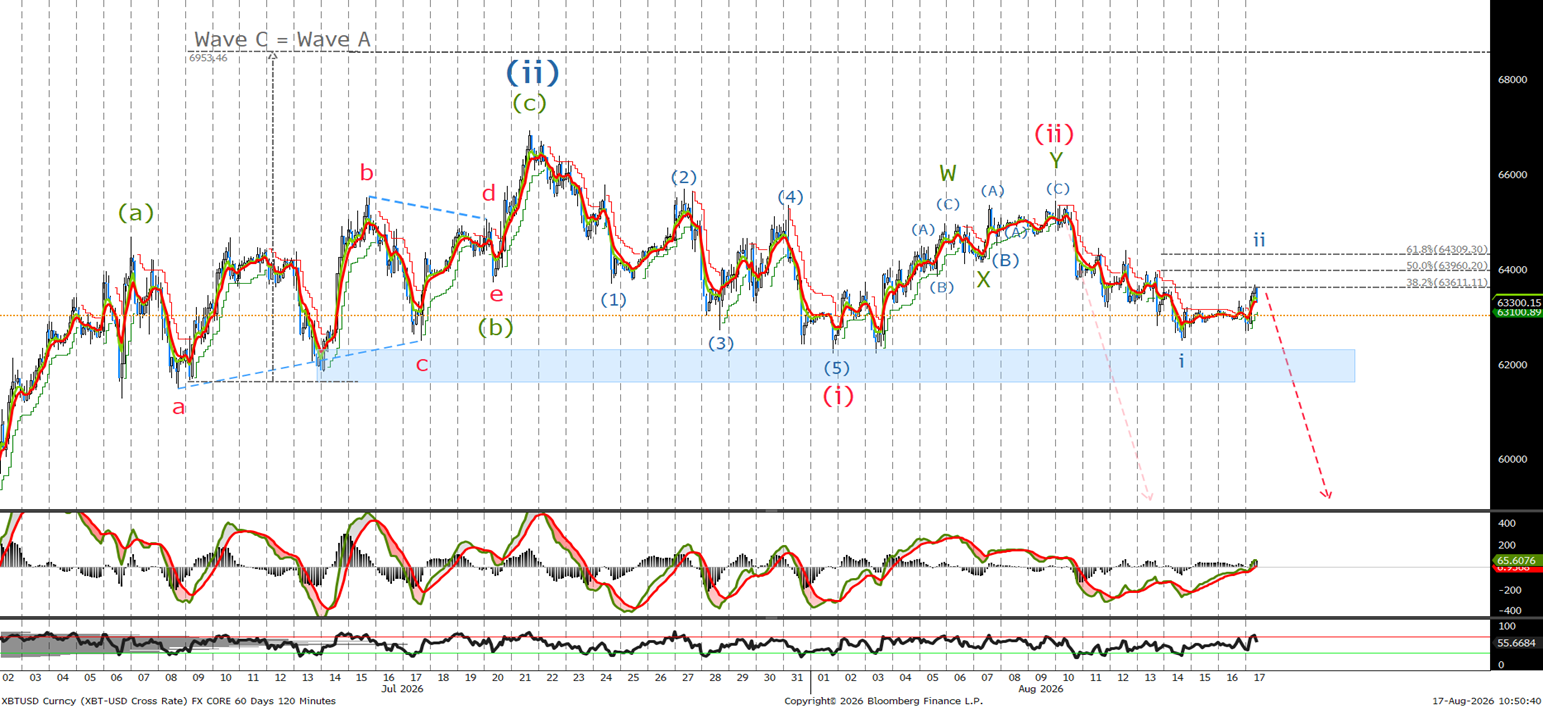
Last time I said, ‘I would sell now at 65220 with stops back at wave (ii) high at 66923.' As you can see from the ghost arrow, we traded lower almost immediately, reaching a low of 62480 to complete wave i. We have corrected in 3 wave to possibly complete wave ii as we tested the 38.2% retacement level. If not short, sell now at 63350 , leave stops at last week's level or lower to 65439. Look to add to short at 63950 and 64300.
Ethereum Long Term Chart
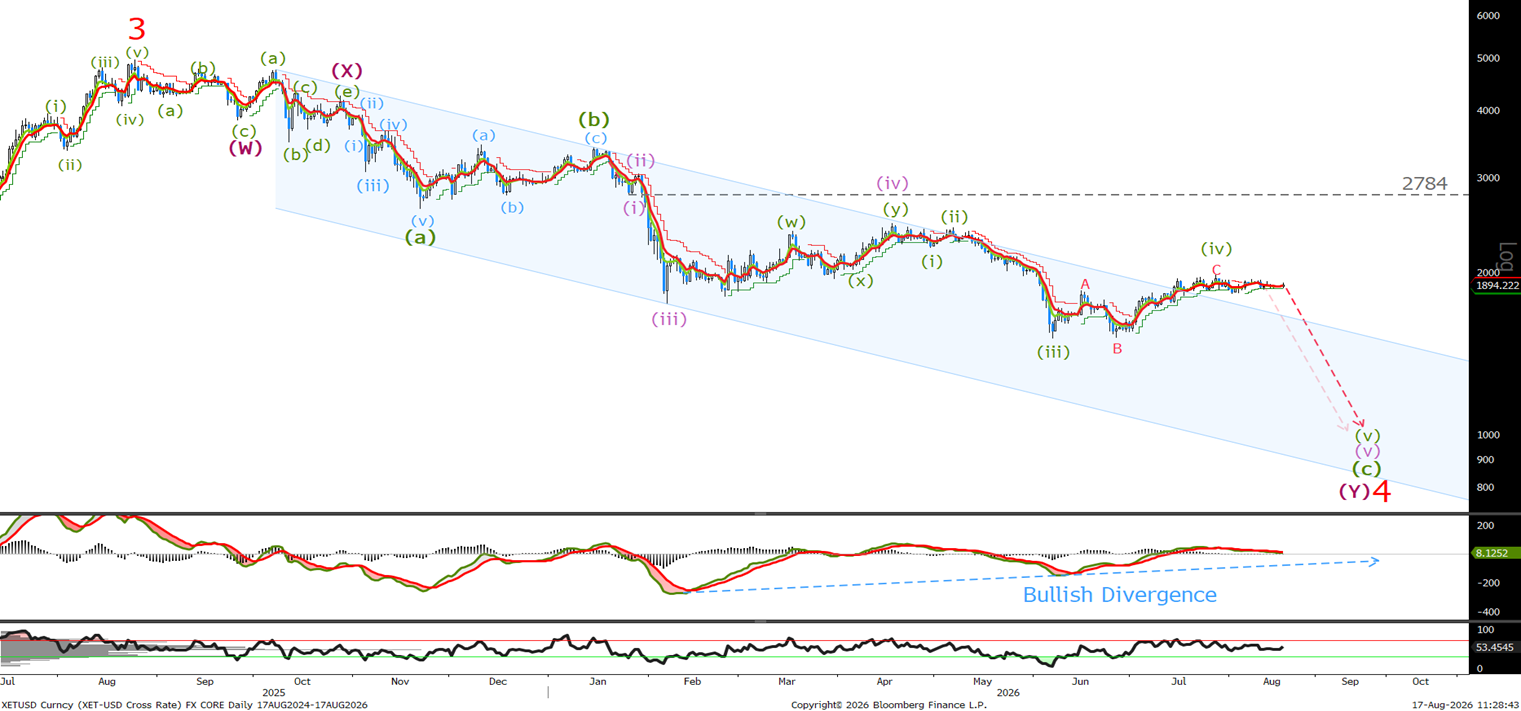
Last week we said ‘Still no change on the daily ETH as we continue to look for lower whilst below 1979. If not short sell now at 1840, with stops above last month's high.’ We need to stay below the wave (iv) high at 1980. A break will signal a target correction towards 2200. Let's look to the short term chart to see if it is time to add to shorts.
Ethereum Short Term Chart
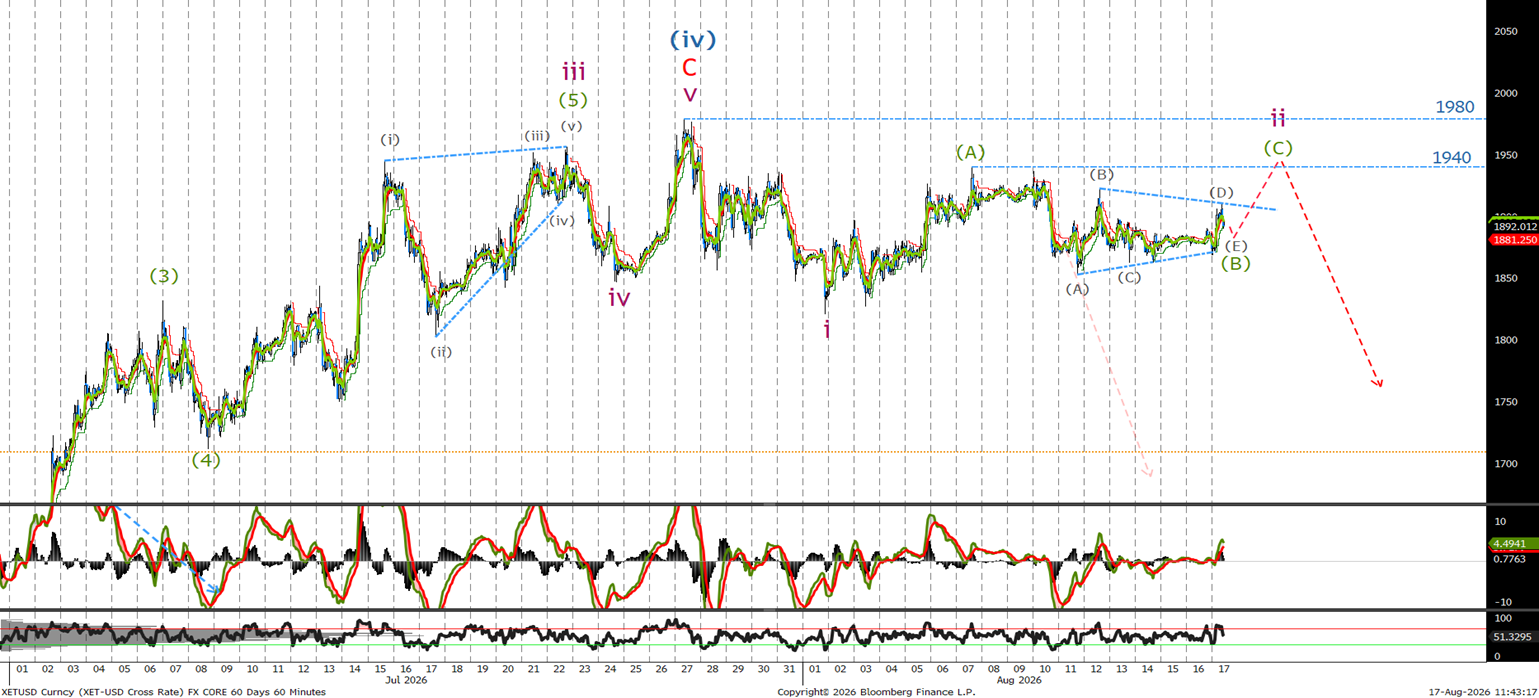
Last time we said, ‘ we are currently trading at 1925. If not short sell now, as I am still expecting a sell-off whilst below 1980.' I have adjusted the count from last week as we appear to be tracing out a triangular correction for wave (B) that when complete should lead to another rally in wave (C) above the wave (A) at 1940 and end below 1980. Look to sell above 1940 with stops above 1980. For a short term trade buy now at 1890 with a stop at 1850. Look to take profit and go short above 1940 with stops at 1980.