Bitcoin Weekly Term Chart
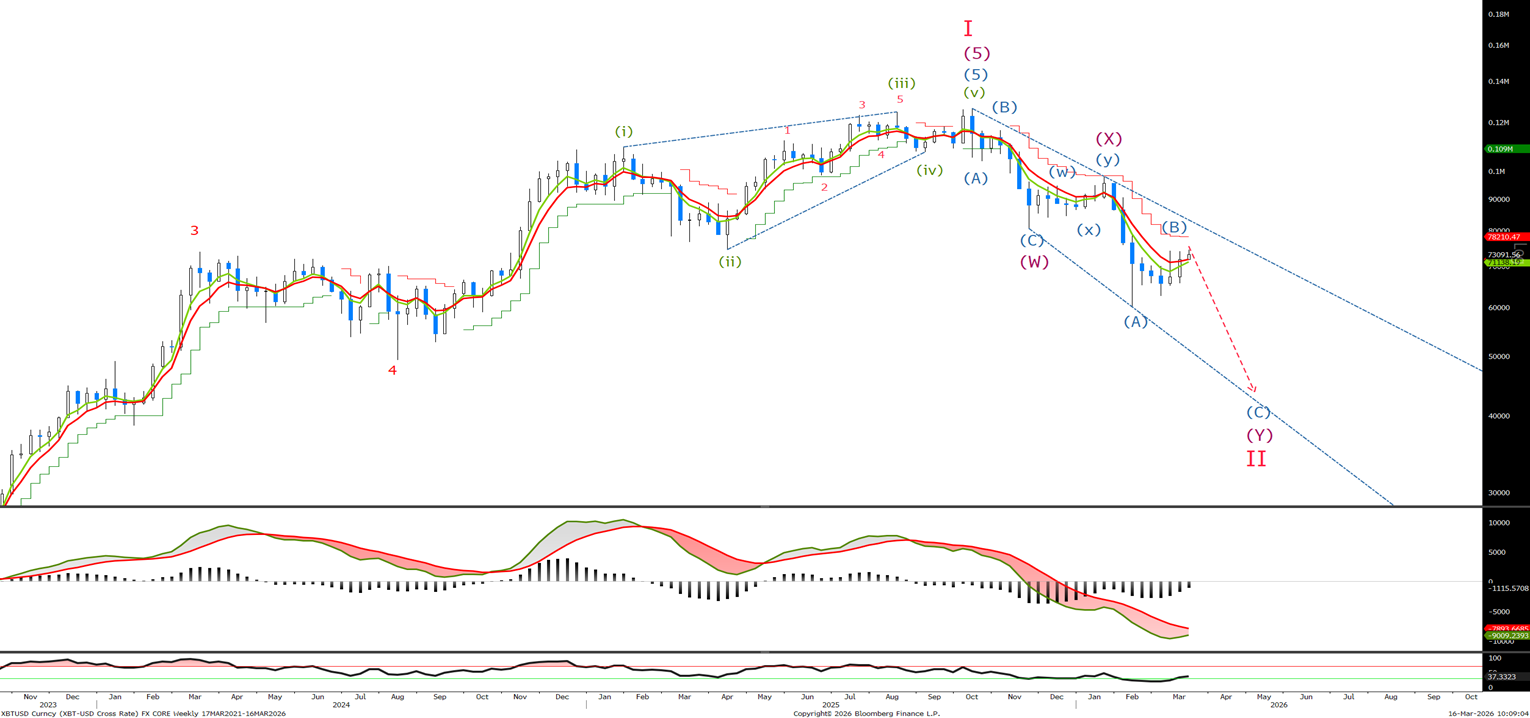
No change in the Weekly view as we continue to wait for wave (B) to end before the next leg lower. Lets look shorter term for signs of possible exhaustion.
Bitcoin Daily Chart
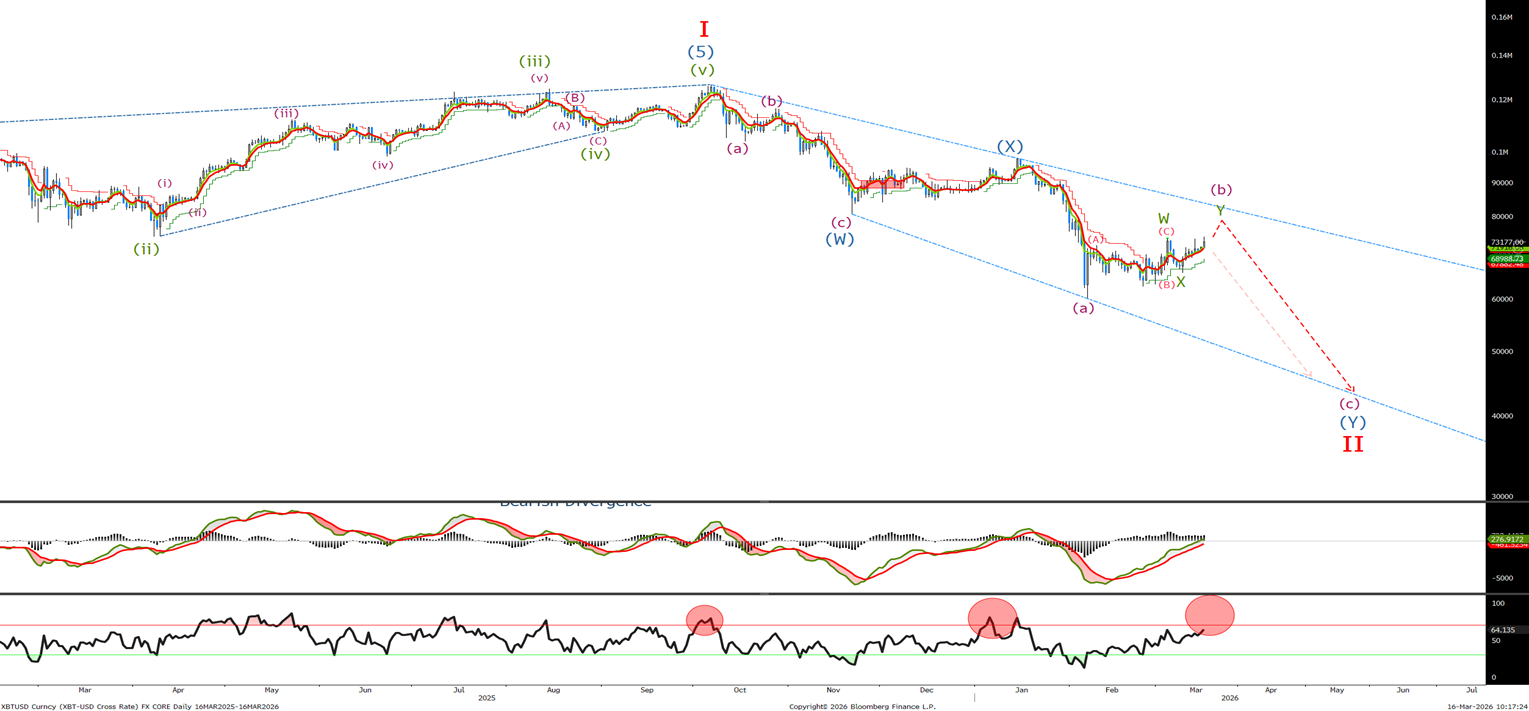
Last time we said ‘It appears that we have completed wave (b) and are entering the final leg of this correction towards the bottom of the channel and the 40000 level.’ Last weeks break of 74k negated that view, and as you can see we are looking for higher towards the top of the wedge before the sell off discussed last week.
Bitcoin Short Term Chart
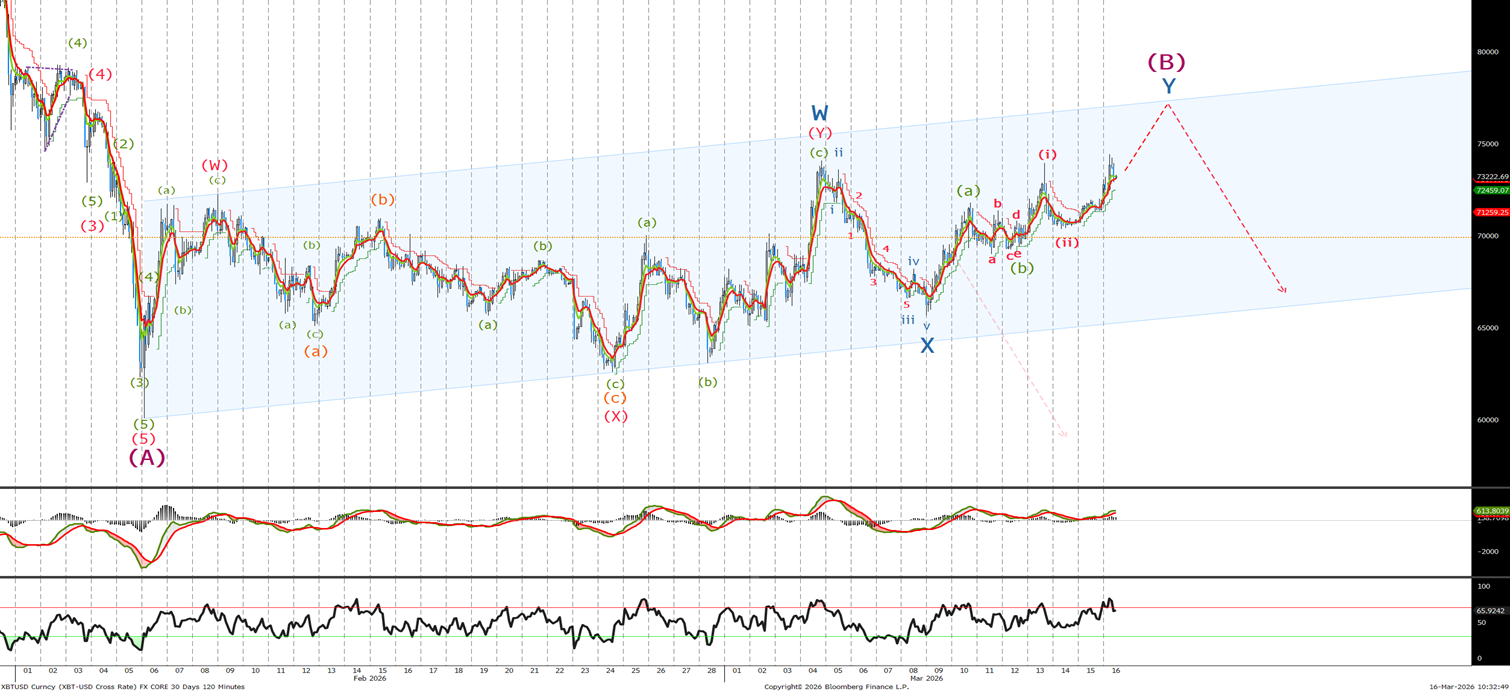
Last time we said ‘Since the high in wave (B) , previously thought wave (c) of a triangle, we have sold off in 5 waves and are currently correcting in wave (ii) I would sell now at 68750, sell again at 70k and 71k with stops above last week's high at 74100.’ What we thought was wave (b), actually turned out to be the first part of a larger WXY pattern. It would appear to me that we need to trade towards the top of the channel and then 79100 level. I would look to sell as we approach there with stops above 91200. Interestingly, wave Y=W at 79095 and wave (B) = 0.5 (A) at 79245 , so look to sell higher.
Ethereum Long Term Chart
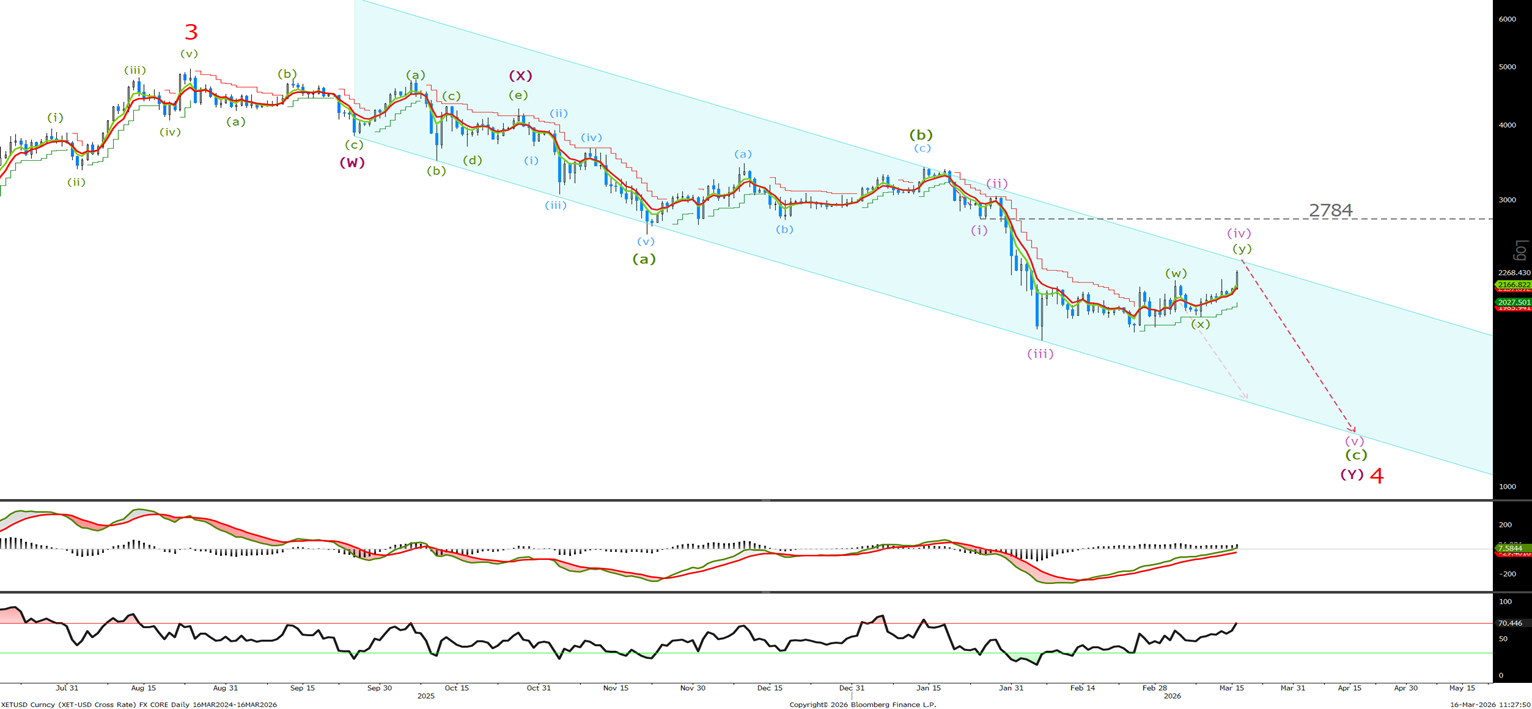
Slight change in the count for the correction, but the bearish view remains valid. Fridays highs puts a larger WXY correction as our preferred count, which once complete will ultimately lead to a 5 wave sell off towards the 1250 level.
Ethereum Short Term Chart
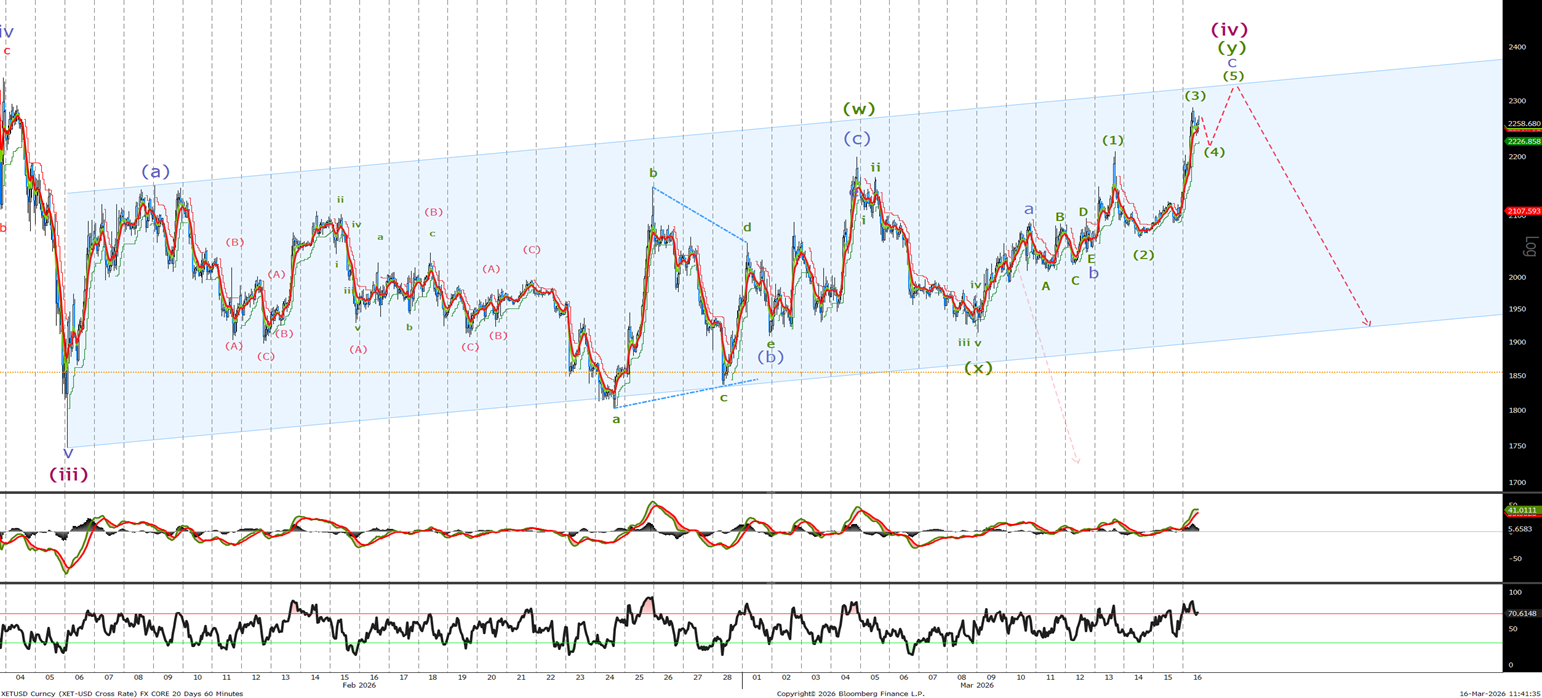
Last time I said ‘Sell now and add at 2055 and 2090 with stops just above last week's high at 2220'. Like BTC the correction is continued more than expected, and I am looking for ETH to push higher in the coming hours to test the top of the channel around the 2320 area. Once this final wave is complete, we expect to see a sell-off with a break of 2060 being the first confirmation that ETH is starting its wave (v) to new lows.