Bitcoin Long Term Chart
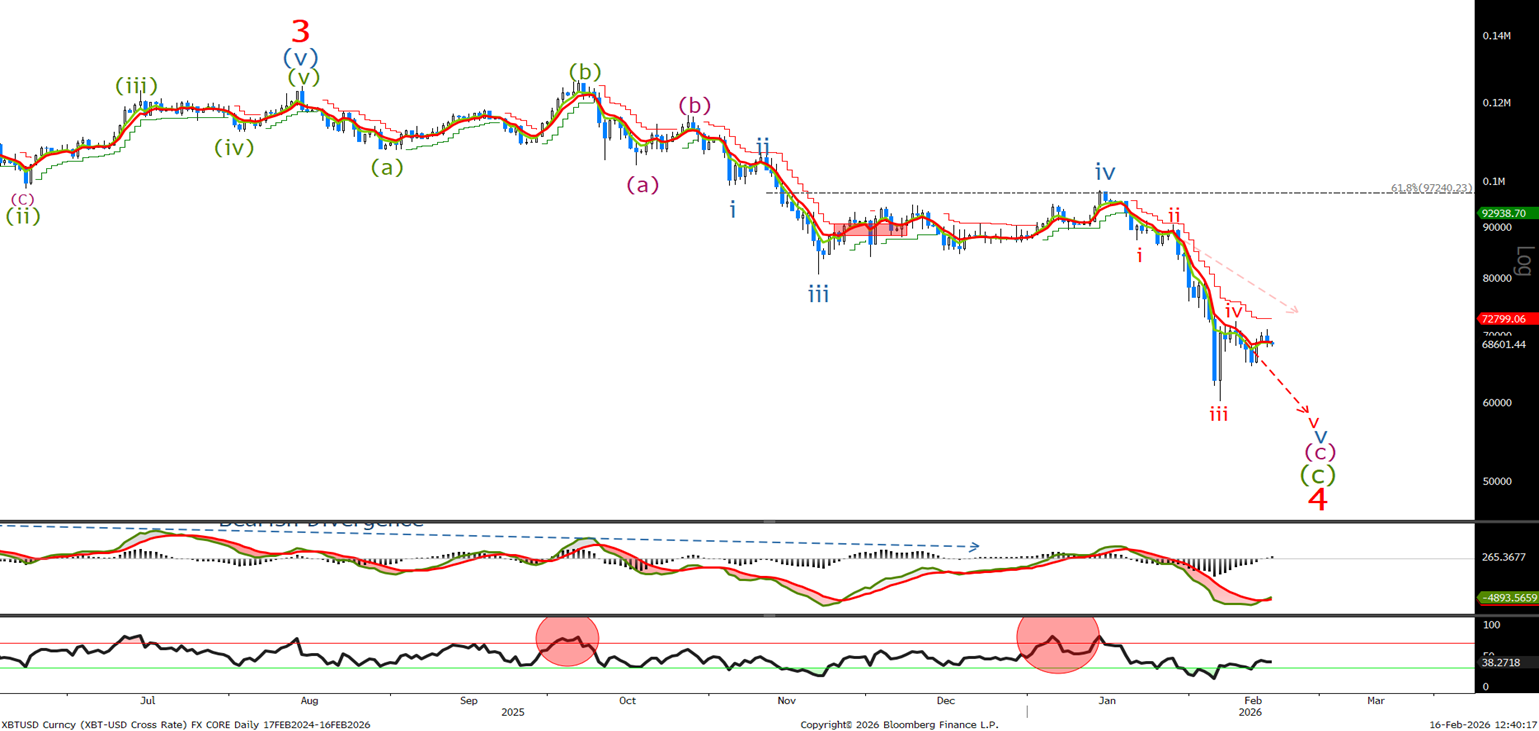
Looking for 5 waves lower in wave v of v to complete the larger wave 4 correction. Lets see where we are in the short term charts.
Bitcoin Short Term Chart
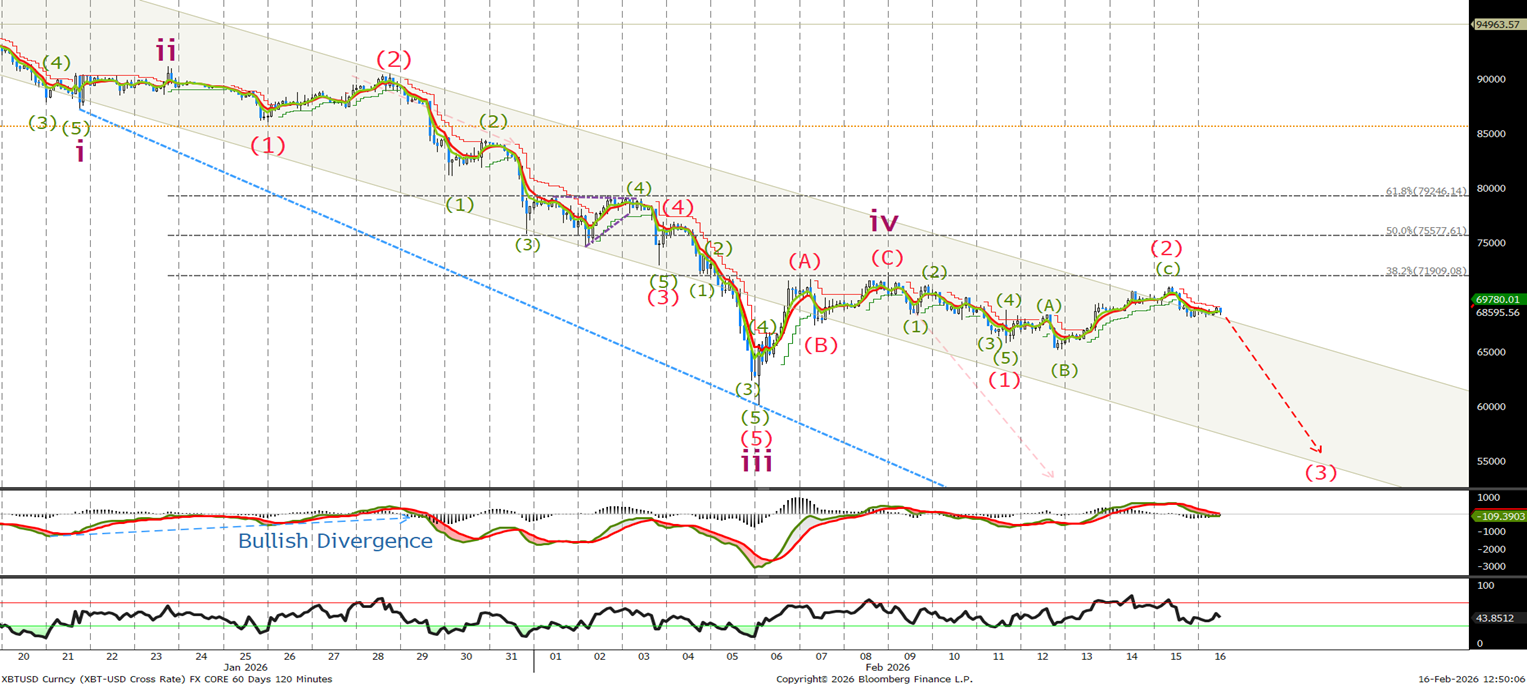
Last time we said ‘I do not rule out a push towards the 50% level and the top of the channel at 75600. With no signs of divergence and downward momentum running out of steam I expect to see another sell off to new lows around the 55k level followed by a test of the 50k. We will look for 5 waves lower in this leg to complete the correction. A break above 88k will cast doubt on this view.’ It looks like we have completed 2 waves so far. A break above the wave (iv) high does not rule out our short term bearish view, and I would use a move into the 75500-79500 to sell with stops above the 88k level. If correct we should see a sharp acceleration to the downside, with a break of 65k confirmating wave (3) is underway.
Ethereum Long Term Chart
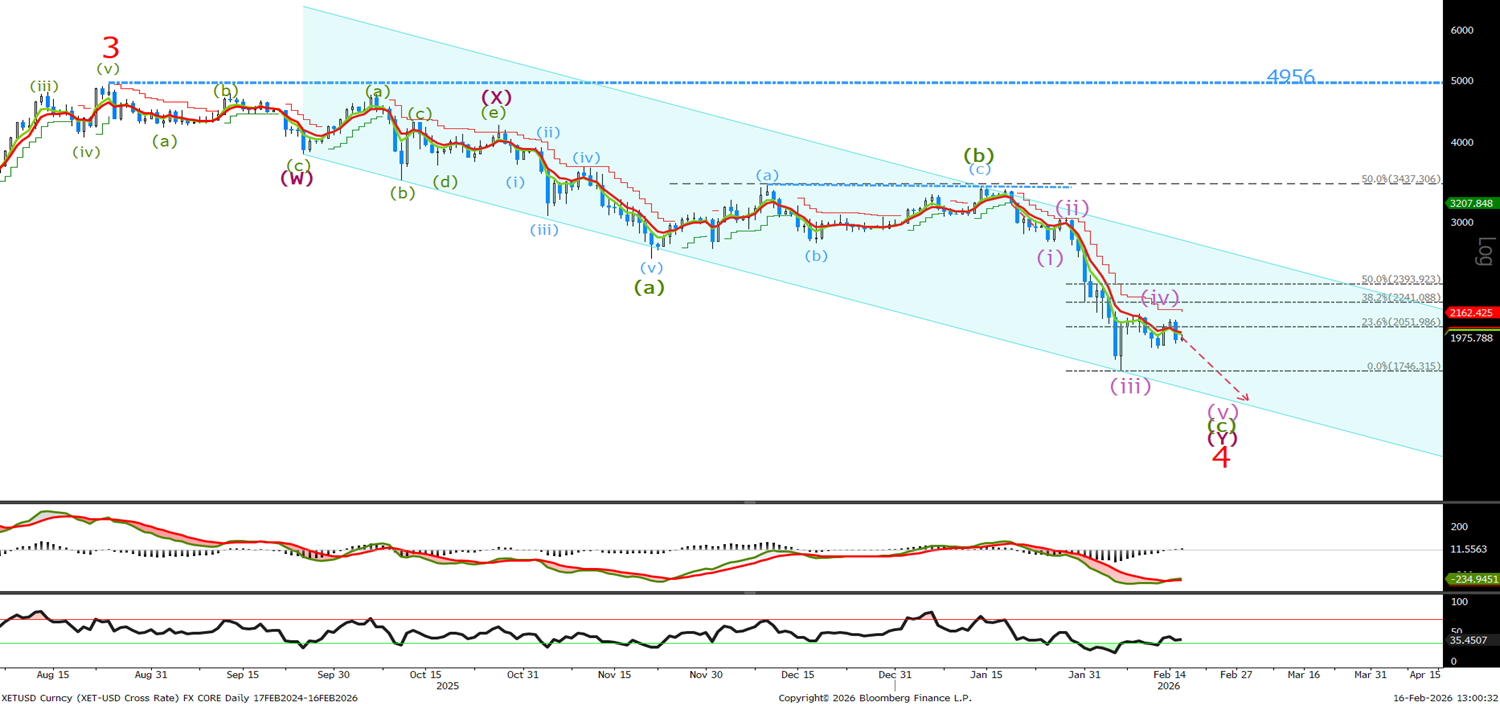
Last time I said ‘I am showing wave (iv) as complete, but we do not rule out another push higher to test the 2241 or 2393 level. Whilst below 2784 we continue to look for a final 5 waves to new lows before a low is in place.’ Nothing has changed and I will sell at the higher levels if wave (iv) hasn’t ended yet.
Ethereum Short Term Chart
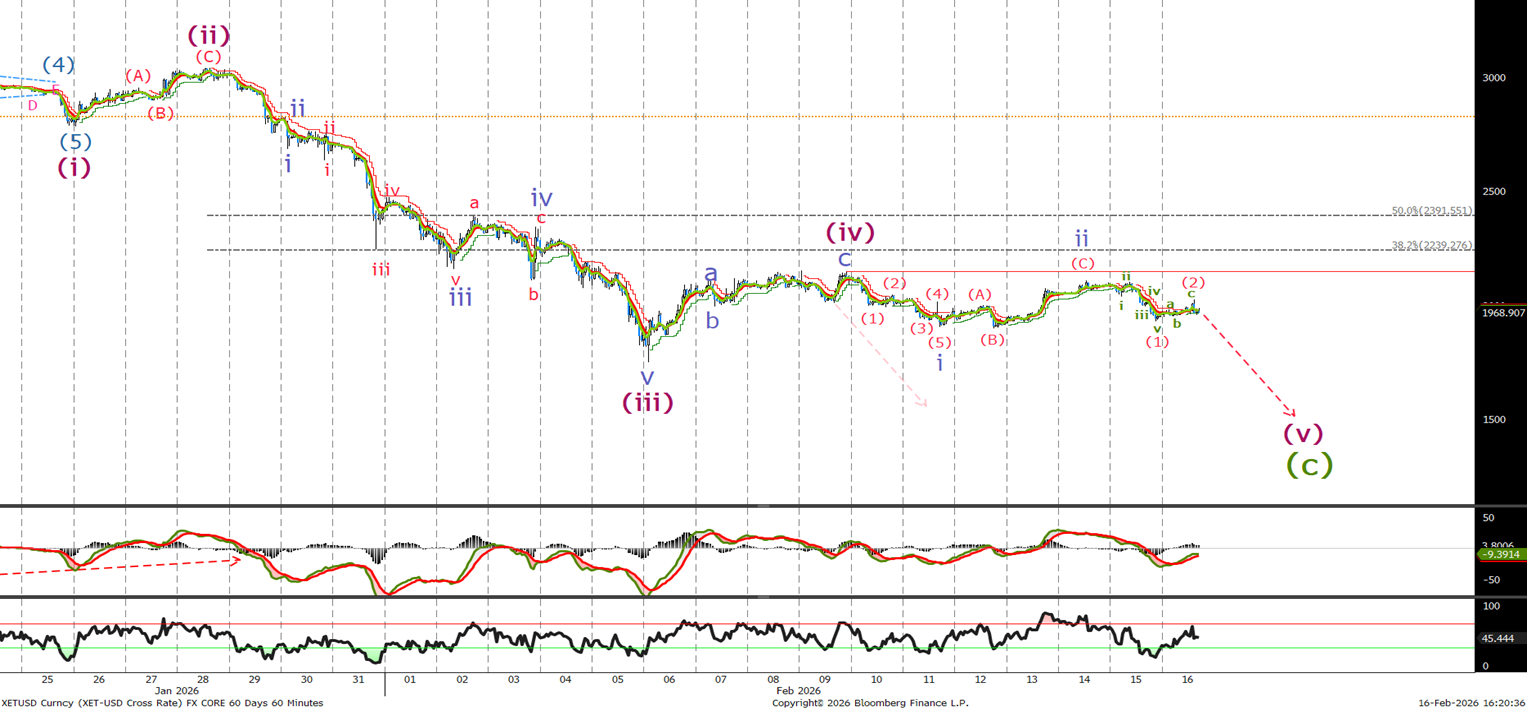
Last time I said ‘I am selling now at 2030 with stops above 2800 for a test towards the 1500-1630 level.’ Since then the high has been 2146 , I do not rule a move to 2240 or 2390, where we would look to sell with stops remaining at 2800. A move below 1900, the wave i low should see an acceleration below 1750 towards the 1600 level.
