
Bitcoin Weekly Chart
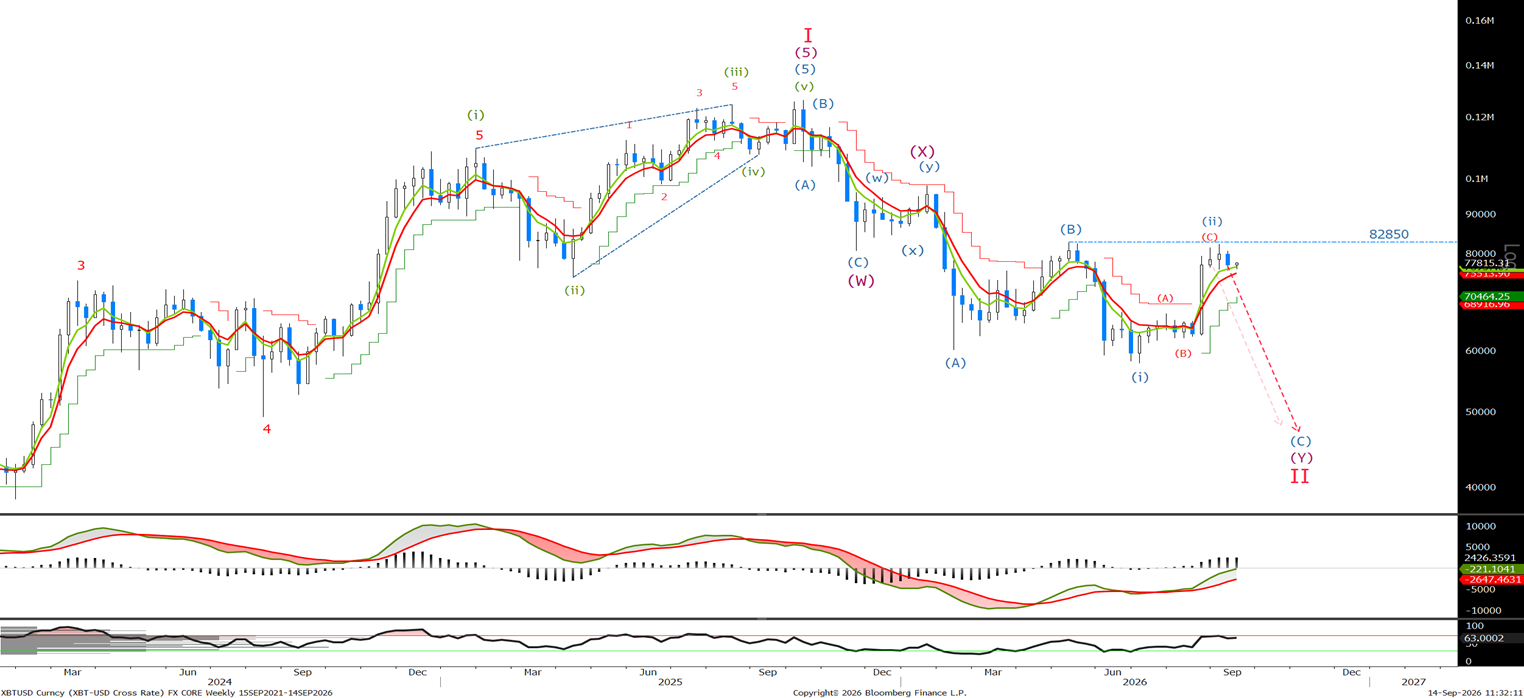
No change on the weekly with 'The limit for wave (ii) is 82850. Let's look to the short term to see how far along we are in wave (C) and if it looks like ending before 82850.' I remain bearish whilst below that level.
Bitcoin Daily Chart
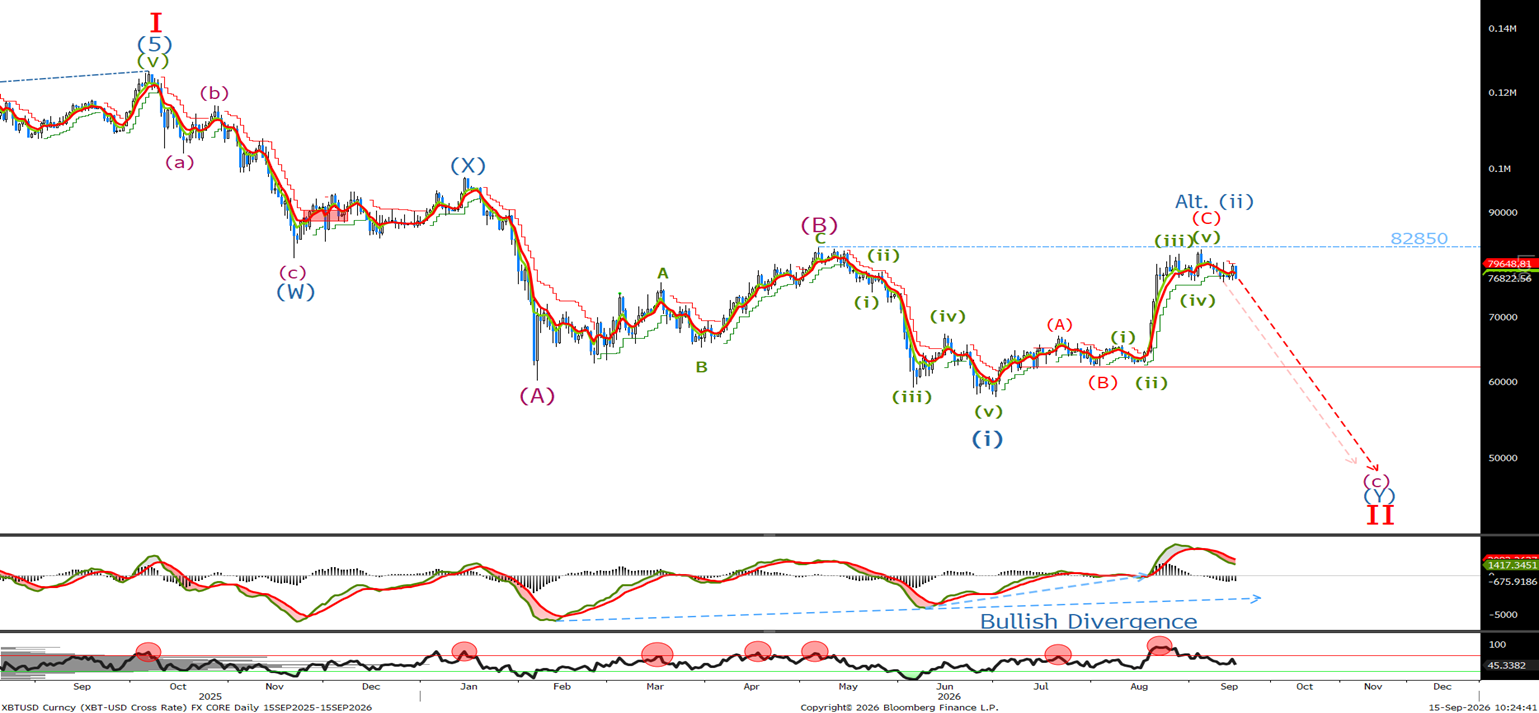
Last week I said ‘I am happy to be short below 82850, so I am selling now with stops above 82850.' We traded down to 76067 before trading up to 79840. Let's look to the short term chart to see where we are in the wave (Y).
Bitcoin Short Term Chart
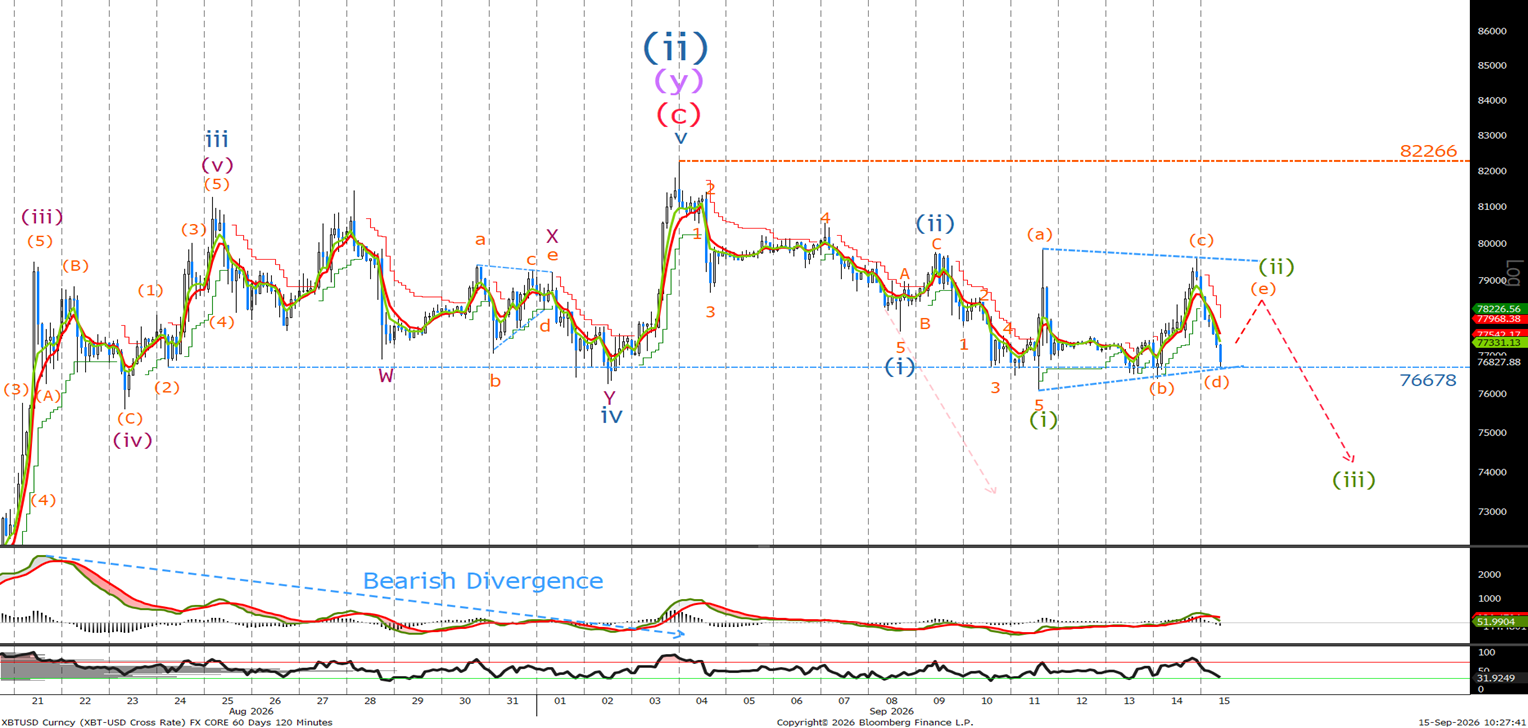
Last time we said ‘No change whilst below 82850 and will add on a 2-hour close below 76650.’ We have traded in what appears to be a corrective triangle and, as yet, have failed to close below 76650. I correct then I expect to see a small rally in the BTC towards 78k level where I would look to sell with stops above 80k.
Ethereum Long Term Chart
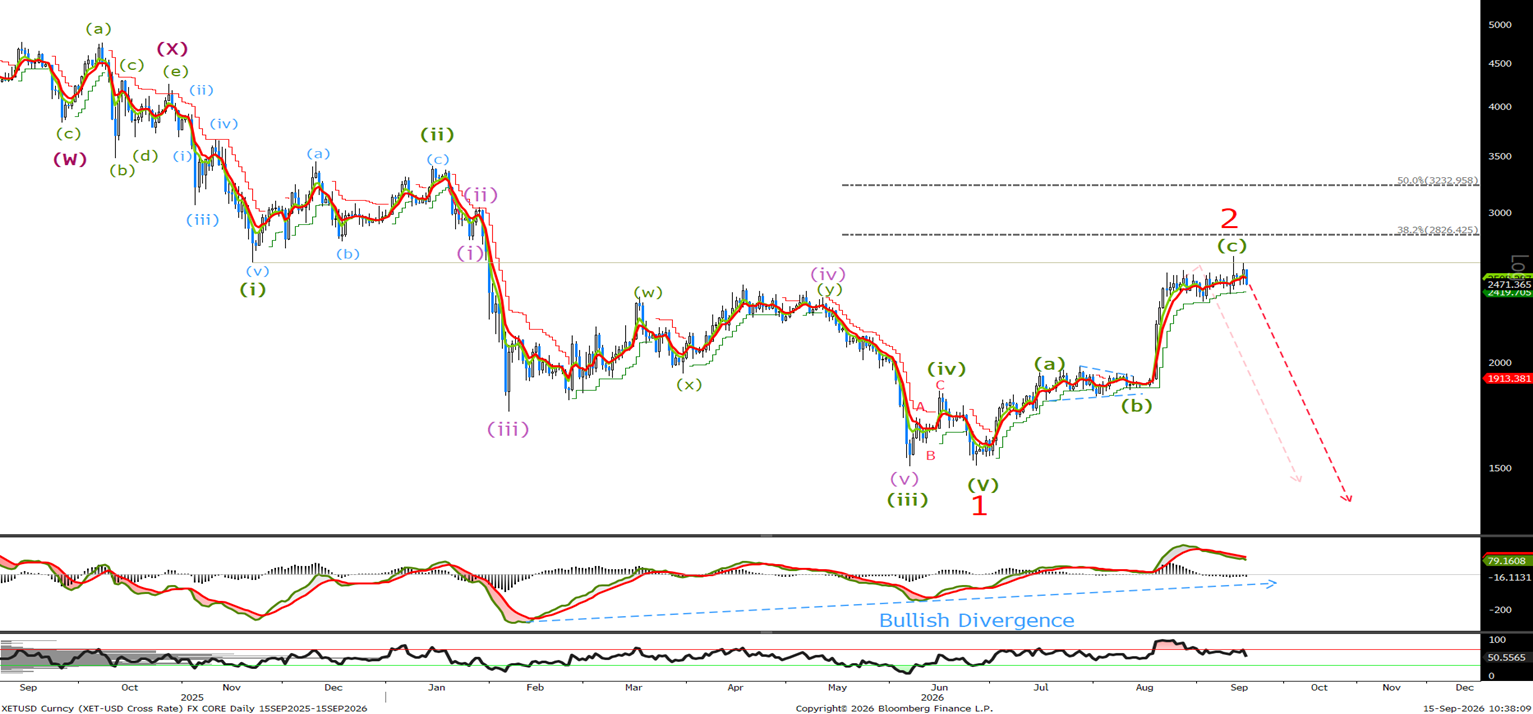
We continue to watch for evidence that wave 2 is complete on ‘ A daily close below 2350 should confirm the downtrend has resumed.’ I would raise that level to 2400 now on a daily close.
Ethereum Short Term Chart
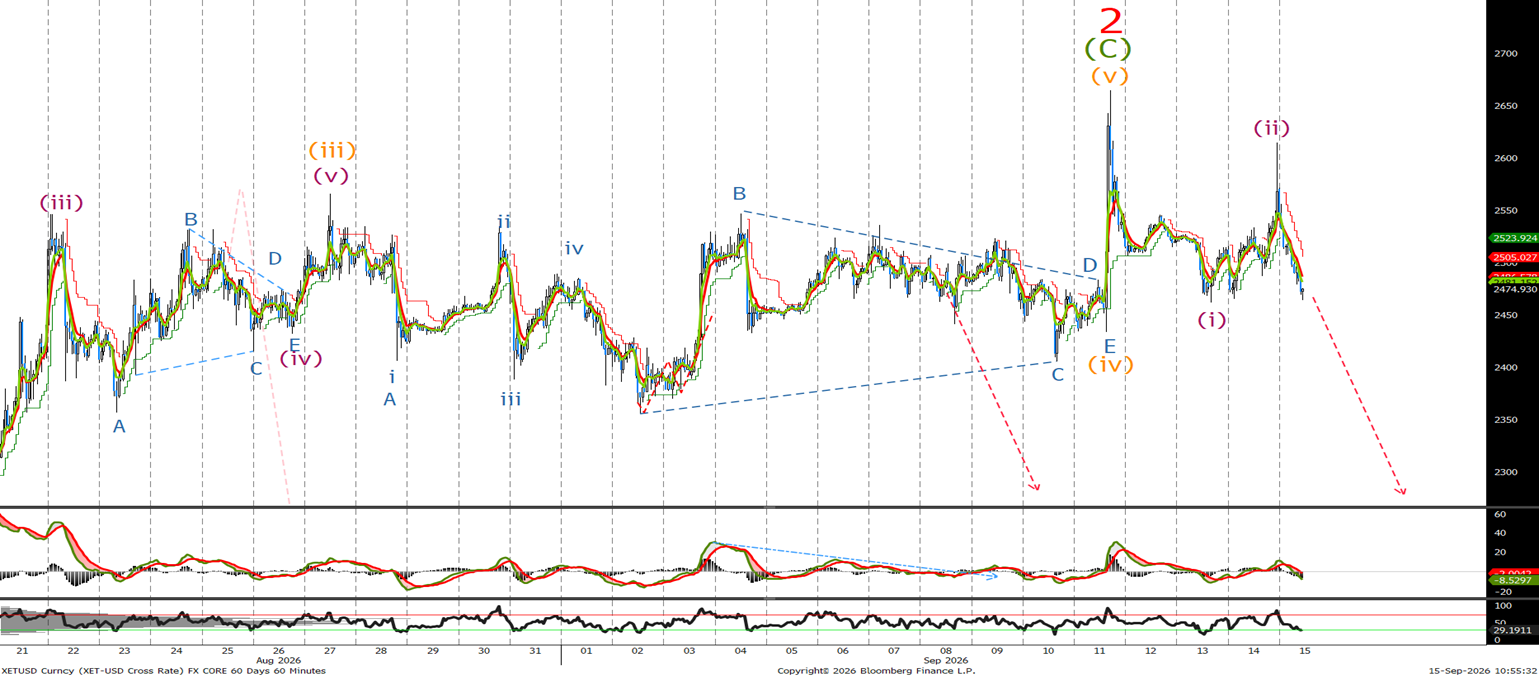
We got stopped on our short position as we made a new high at 2664. We were aware last week that 'There is a possibility that we are tracing out a corrective triangle for an ongoing wave (iv) in the long-term chart, that call for one more push higher before the wave 2 is over, but I will show that if it comes into play and prefer to remain bearish at this time.' That appears to be what happened and if correct we should see ETH sell off whilst below there. An hourly close below 2350 will confirm that wave (iii) lower is underway.