
Bitcoin
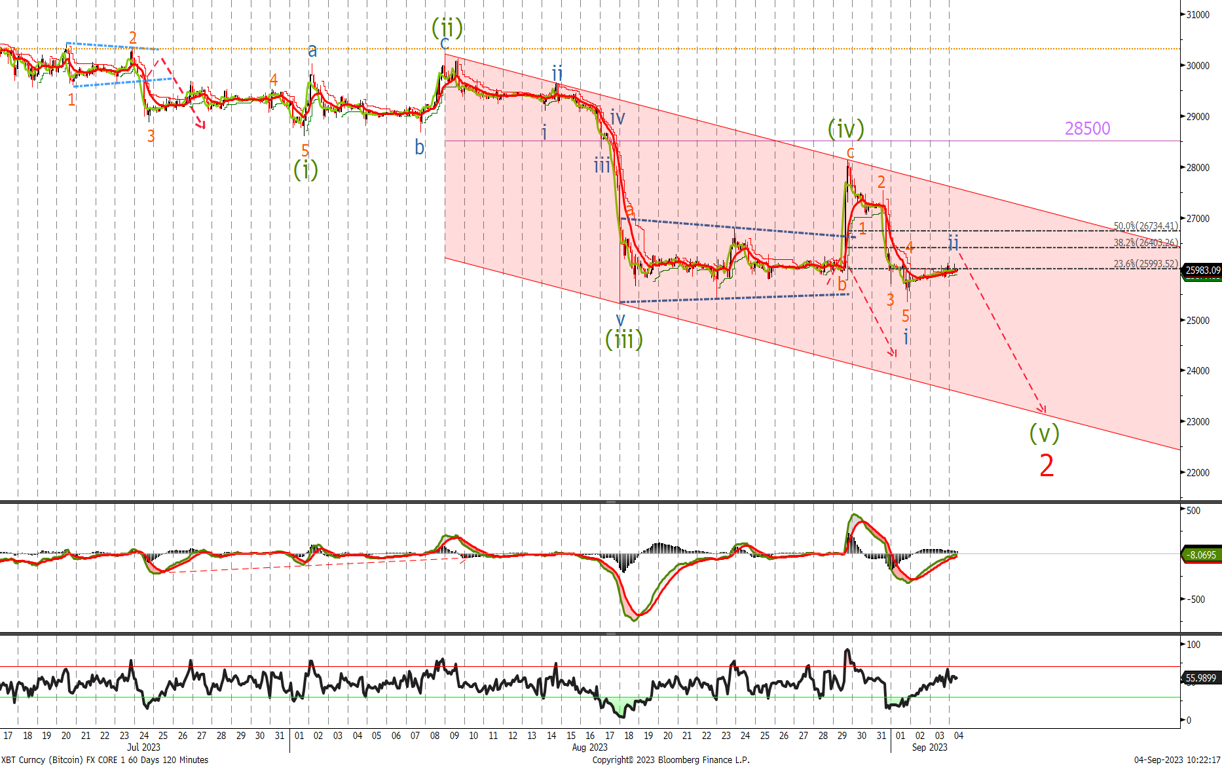
Last time we said:
we are trading sideways in a wave (iv) corrective triangle. I am looking for a break to the downside and test towards the $23k level to complete the 5 waves lower and end the wave 2 correction. Look to buy at $23'250 and add at $22'747
The correction took the form of a zigzag but we stopped below the $28'500 level. It appears that we have complete wave i of (v) and we will continue to look for lower whilst below $28'150 and look to buy at last week's levels.
Ethereum
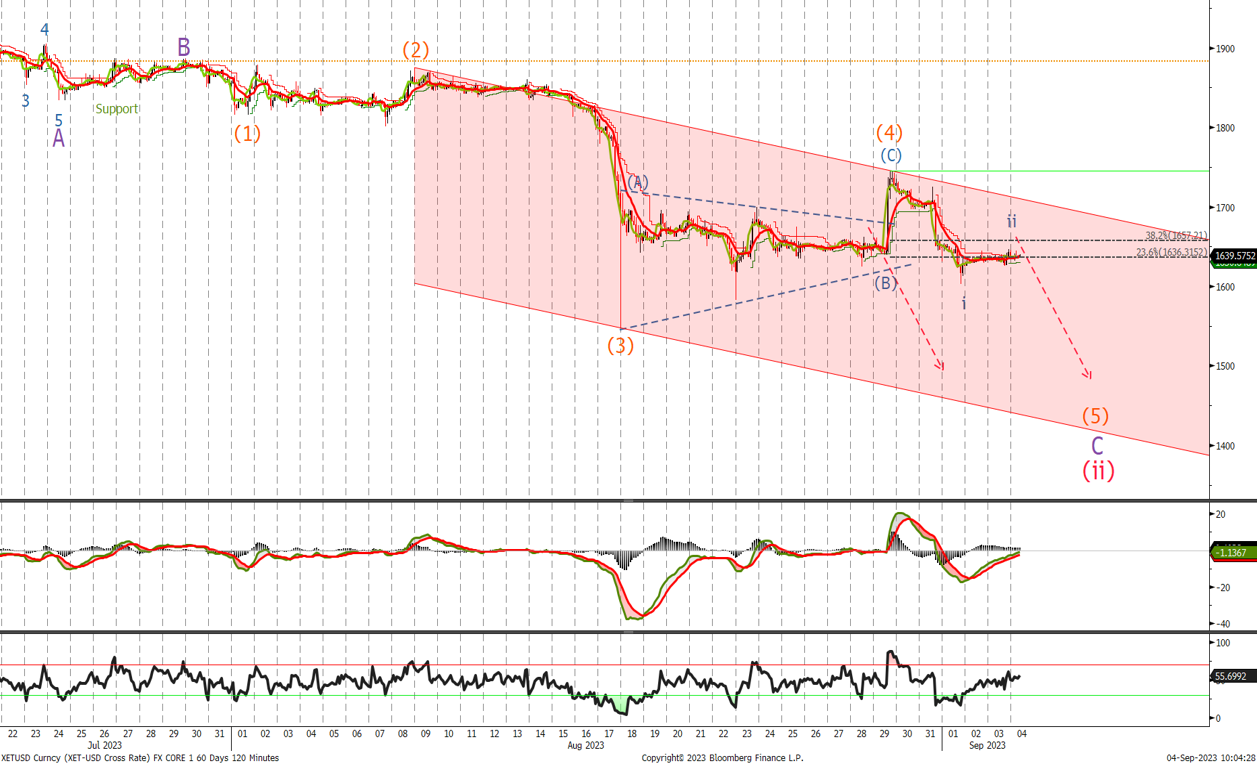
Last time we said:
I expect to see a break out of the triangle correction with a move towards the $1'500 level where we will start buying the ETH adding again at $1'440 and $1'390
I wasn’t expecting the spike higher but the view remained valid and we look to sell now in the $1'636-$1'657 area with stops above $1'750 for a move lower in 5 waves to last week's levels.
