
Bitcoin
We were bullish:
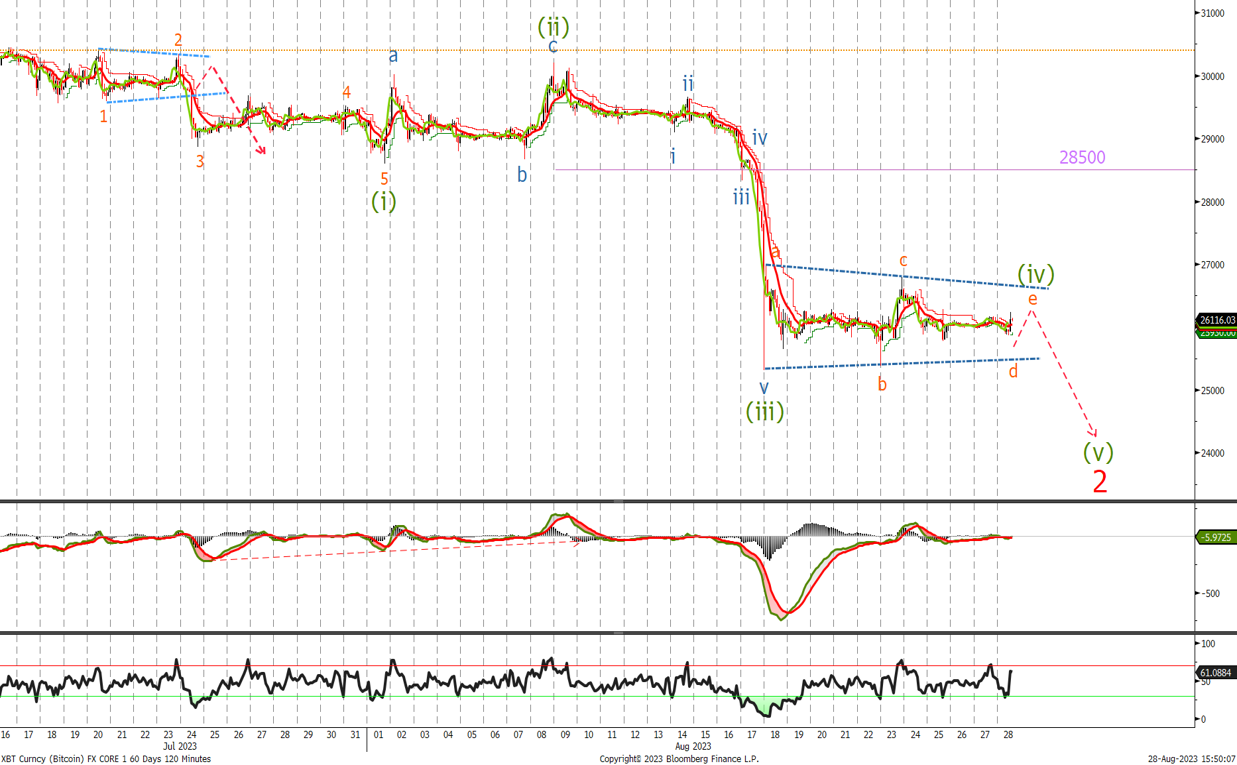
Whilst above the $28'500 level
As you can see from the chart once we broke that level we sold off sharply to put the short term bearish view into play. We stopped at $25'134 to end what should be the major wave (iii) lower. Since then we are trading sideways in a wave (iv) corrective triangle. I am looking for a break to the downside and test towards the $23k level to complete the 5 waves lower and end the wave 2 correction. Look to buy at $23'250 and add at $22'747.
Ethereum
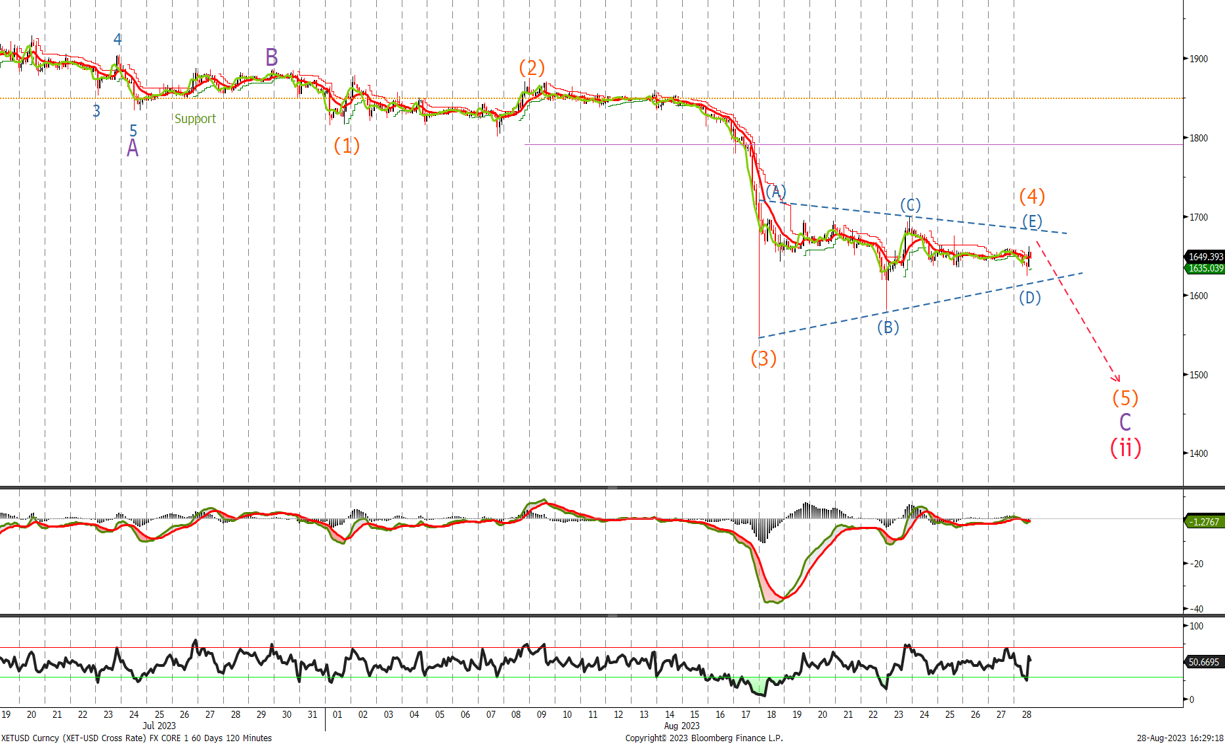
Like BTC, we got stopped in ETH at $1'790, the purple line. I expect to see a break out of the triangle correction with a move towards the $1'500 level where we will start buying the ETH adding again at $1'440 and $1'390.
