Bitcoin
Last time we said:
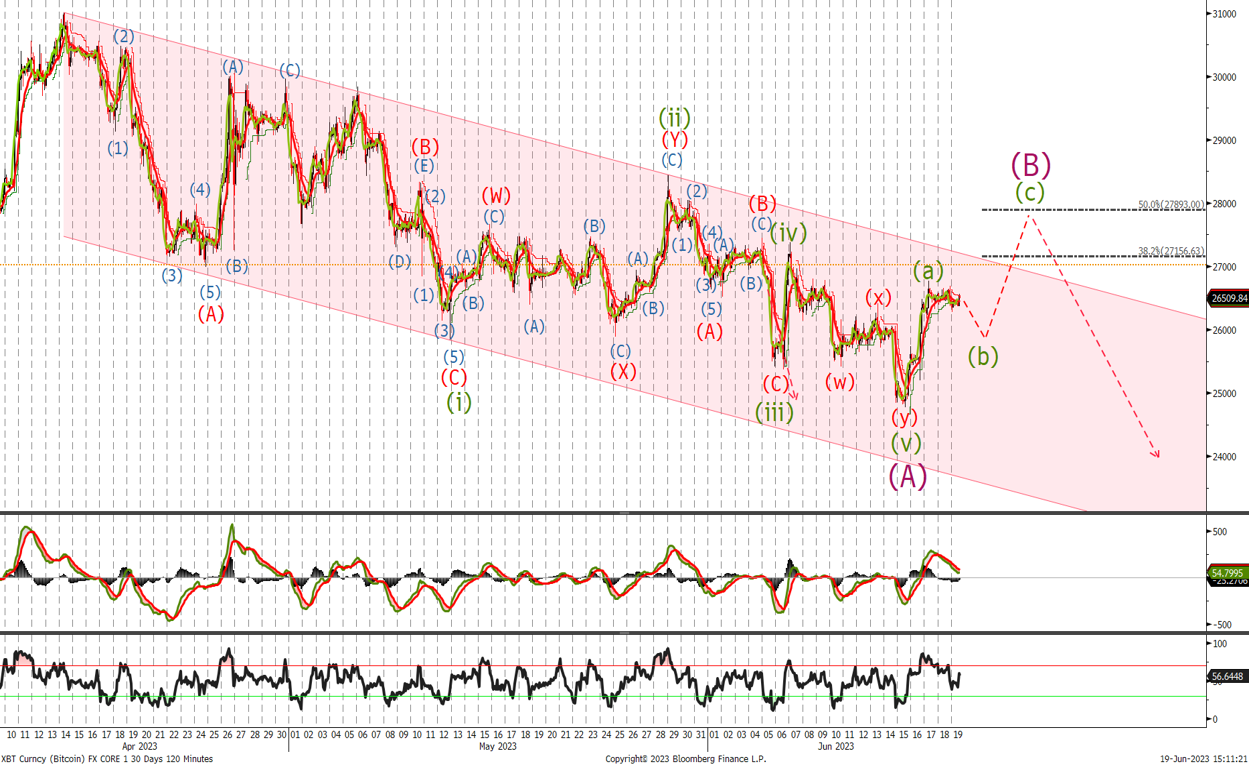
‘Look for a sell-off to the bottom of channel whilst below $28'500. Wave Y will be equal to wave W at $23'260 but we would start buying around the $24k level and the bottom of the channel’
We fell short of my target and whilst below $28'500 I am allowing for further weakness. I have adjusted the wave count accordingly and will be on the look out for divergence in the momentum indicators as a precursor to a possible low. Sell in the $27'150-$27'890 area with stop and reverse above $28'500 looking for a test of the $22'380 level.
Ethereum
Last time I said:
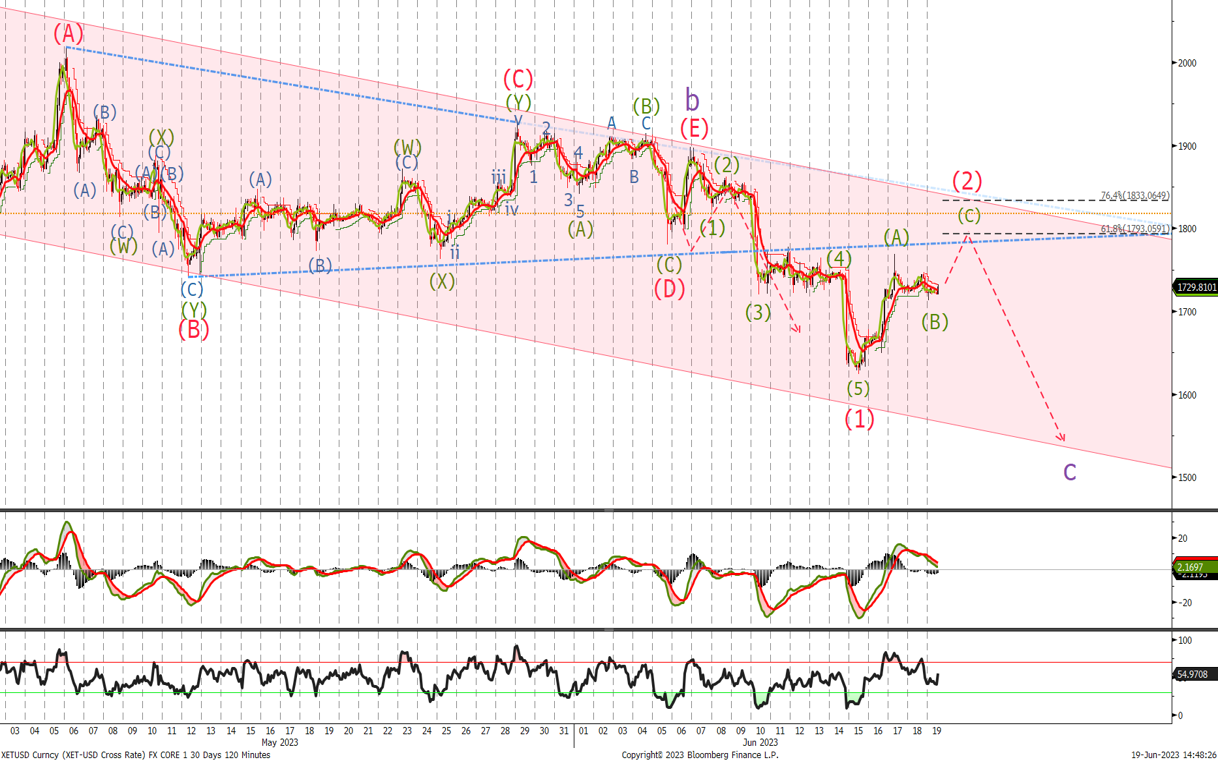
‘we are in a corrective triangle that will ultimately break to the downside and sell off towards a mew target of 1580 where we would start buying again with stops at last weeks level. When the correction is over and we should see a sharp acceleration higher in wave (iii)'
We can count a clear 5 waves down which I am showing as the first leg lower as we fell short of our $1'580 target stopping short at $1'623. There is no signals indicating that momentum to the downside is waning so whilst below $1'900 I will remain bearish. Look to sell in the $1'793-$1'833 area and the top of the channel with a stop and reverse above $1'900.
