Bitcoin
Last time we said:
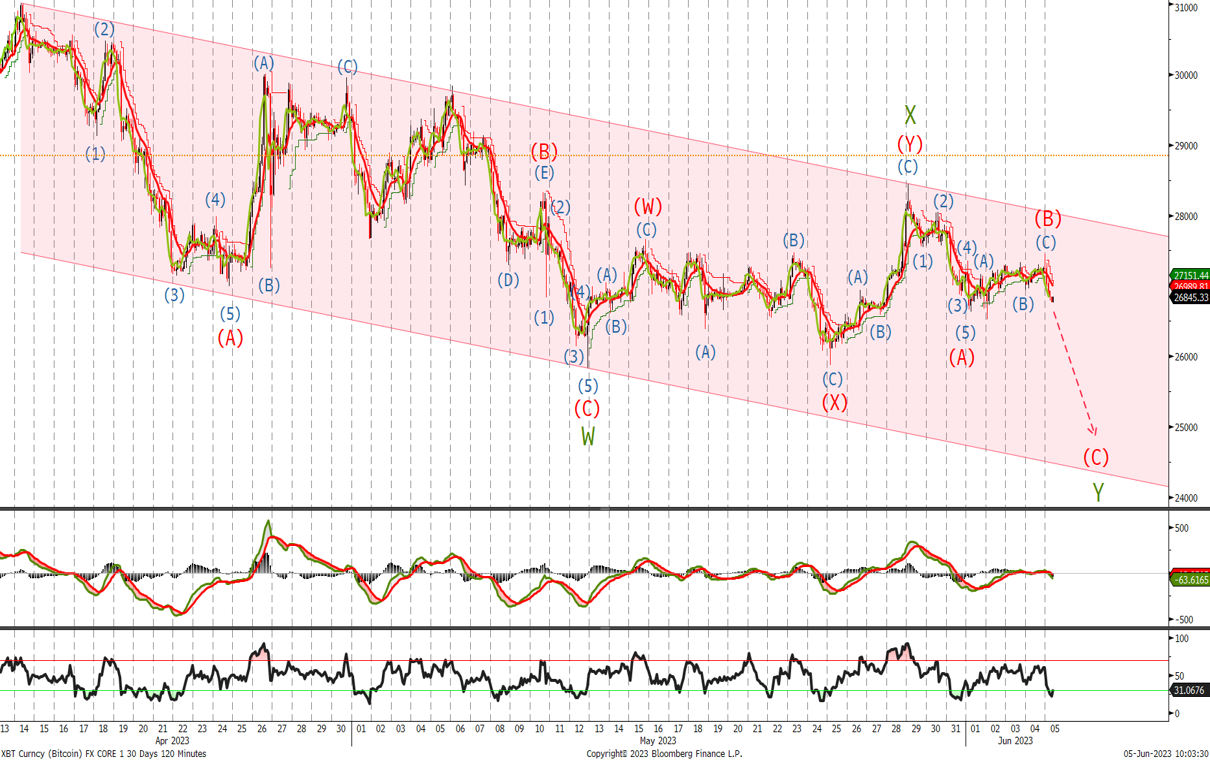
‘I believe we should see further consolidation followed by a break of the 26300 level which should see an acceleration towards the bottom of the channel to complete 5 waves for wave C. Wave A and wave C would be equal in length at 24274 where we would look to start buying again’
I have changed the wave count but the underlying view remains the same. Look for a sell off to the bottom of channel whilst below $28'500. Wave Y will be equal to wave W at $23'260 but we would start buying around the $24k level and the bottom of the channel adding at the $23'260 level. Once this correction is complete we should see a sharp acceleration to the topside.
Ethereum
Last time I said:
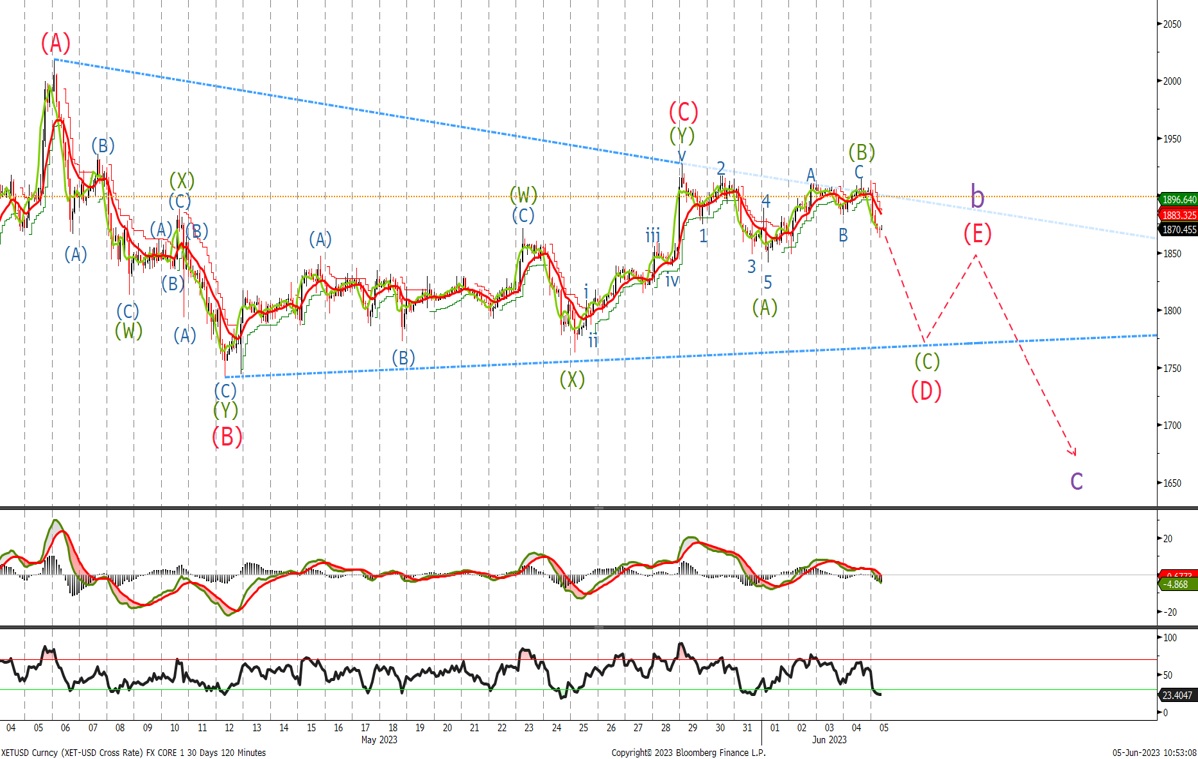
'I think we will trade slightly higher towards the 1880 level and the top of the channel from there we expect to see another 3 waves lower toward the 1660 level where wave c will be equal in length to wave a. We would start buying down there with stops below 1370'
We traded higher than expected to $1'927 and have since ranged making me think that we are in a corrective triangle that will ultimately break to the downside and sell off towards a new target of $1'580 where we would start buying again with stops at last week's level. When the correction is over and we should see a sharp acceleration higher in wave (iii).
