Bitcoin Weekly Chart
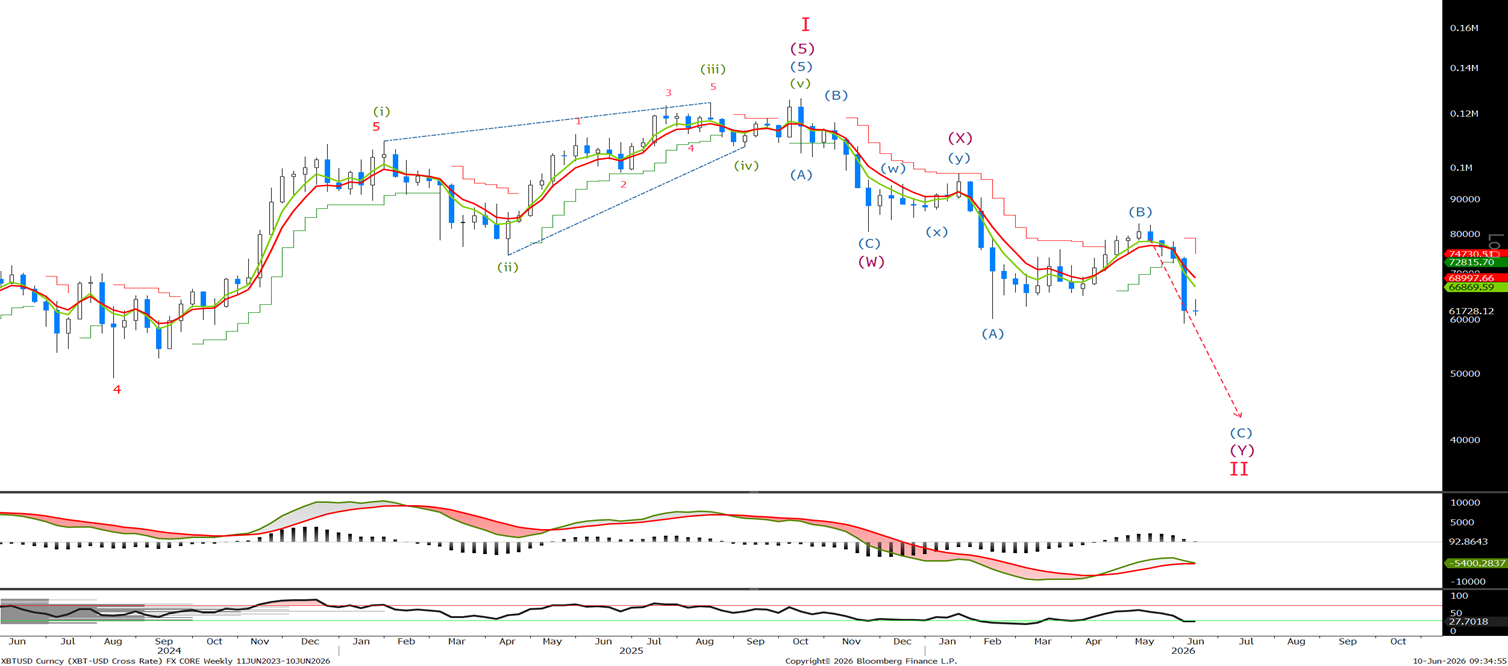
No change to the view: ‘We remain bearish on the BTC and I have left the arrow unchanged on a weekly basis. Let's look at the short-term charts as we continue to look for BTC to trade below 60k.’ We traded down to 59107, so our minimum target has been met with a new low, but let's look to the shorter-term charts to see where we are in the current sell-off.
Bitcoin Daily Chart
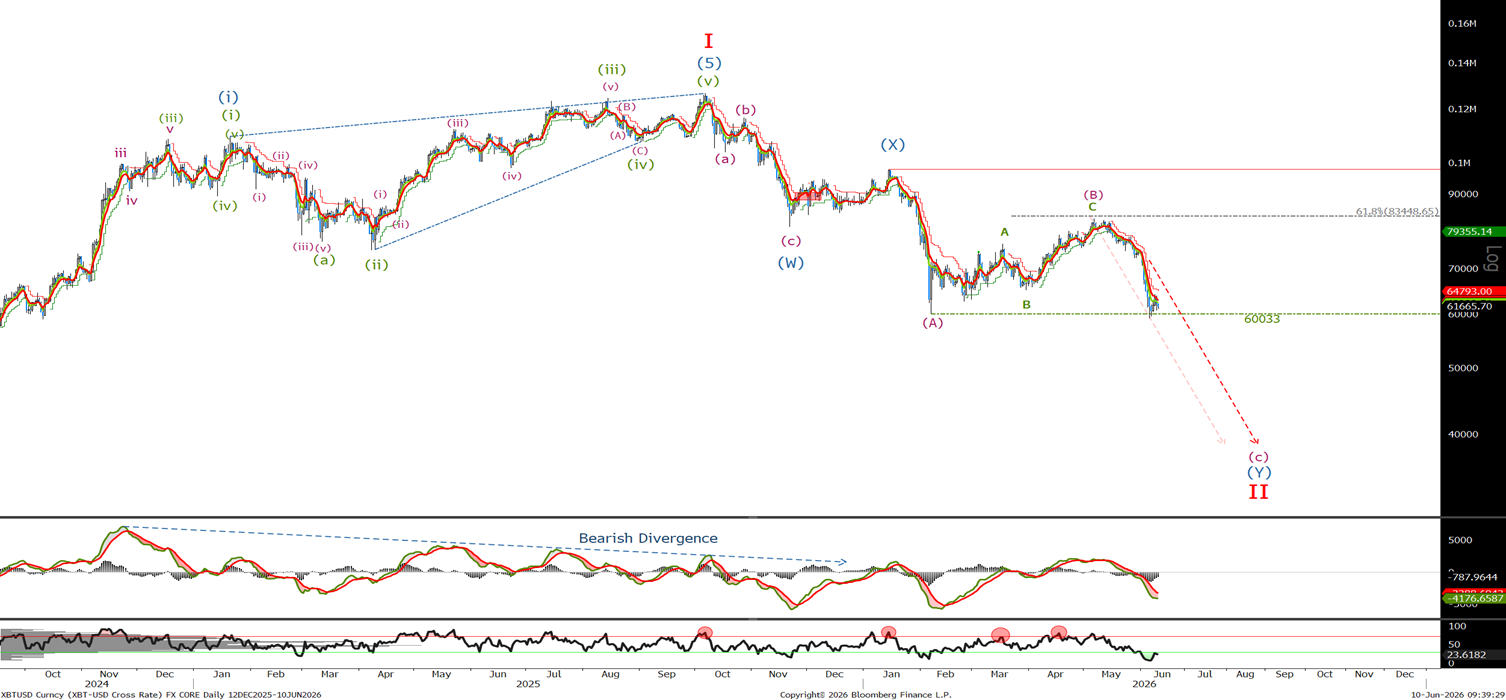
Last week we said 'As you can see, we have continued to sell off, and we are approaching the minimum target for wave (c) below 60033.' We broke that level, but we will need to break the short-term chart down as I continue to look for BTC to work its way lower in the coming weeks for any possible selling opportunities.
Bitcoin Short Term Chart
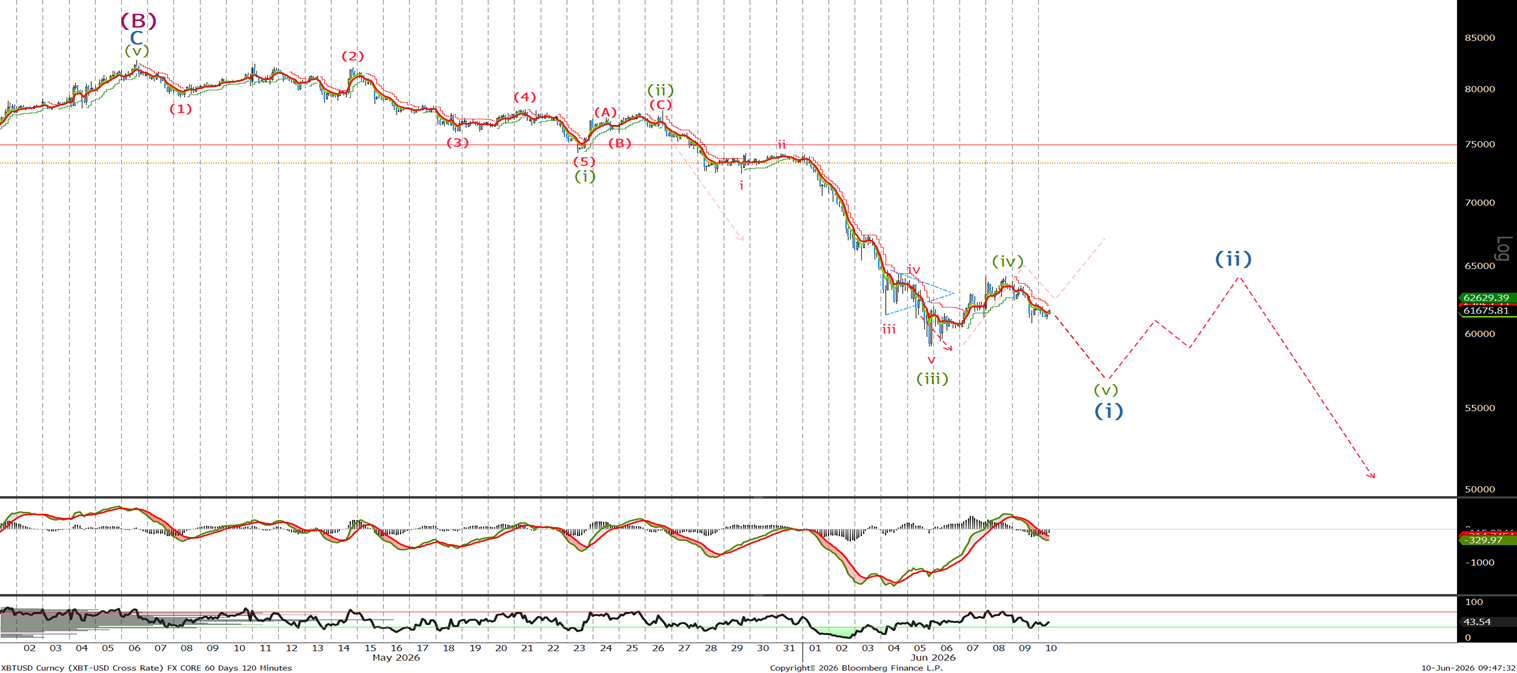
Last time I said, 'As I type this, it appears we are in the final wave v of wave (i). This will probably be towards the 60k level. Once complete, we will see a 3 wave correction which will provide an opportunity to resell. There is a saying in trading to never try and catch a falling knife, so I will let this final wave play out before looking for sale levels. There could be a lot of stop losses below 60k, so it will be interesting to see how the next few days play out.' I have relabeled the chart, with the sell-off on the break, I was expecting being short-lived, and it looks to me that we have either completed wave (iv), but if we trade higher before making a new low look to sell at 66250, 68500 and again at 73k with stops above 78k.
Ethereum Long Term Chart
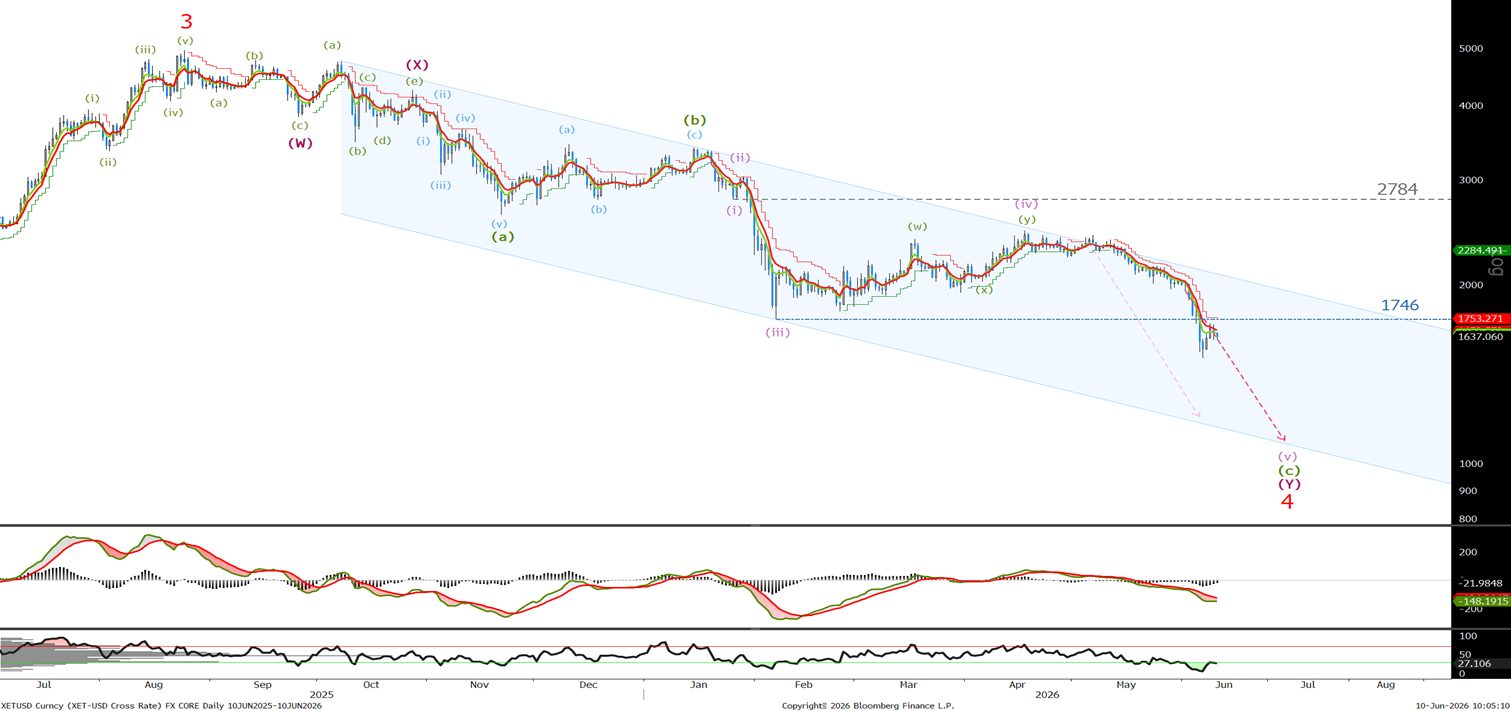
In the last update, we had just broken the 1746 level and since then we have traded down to 1505 before trading back to 1720. Let's break down the short-term chart to see what this recent correction off the lows represents.
Ethereum Short Term Chart
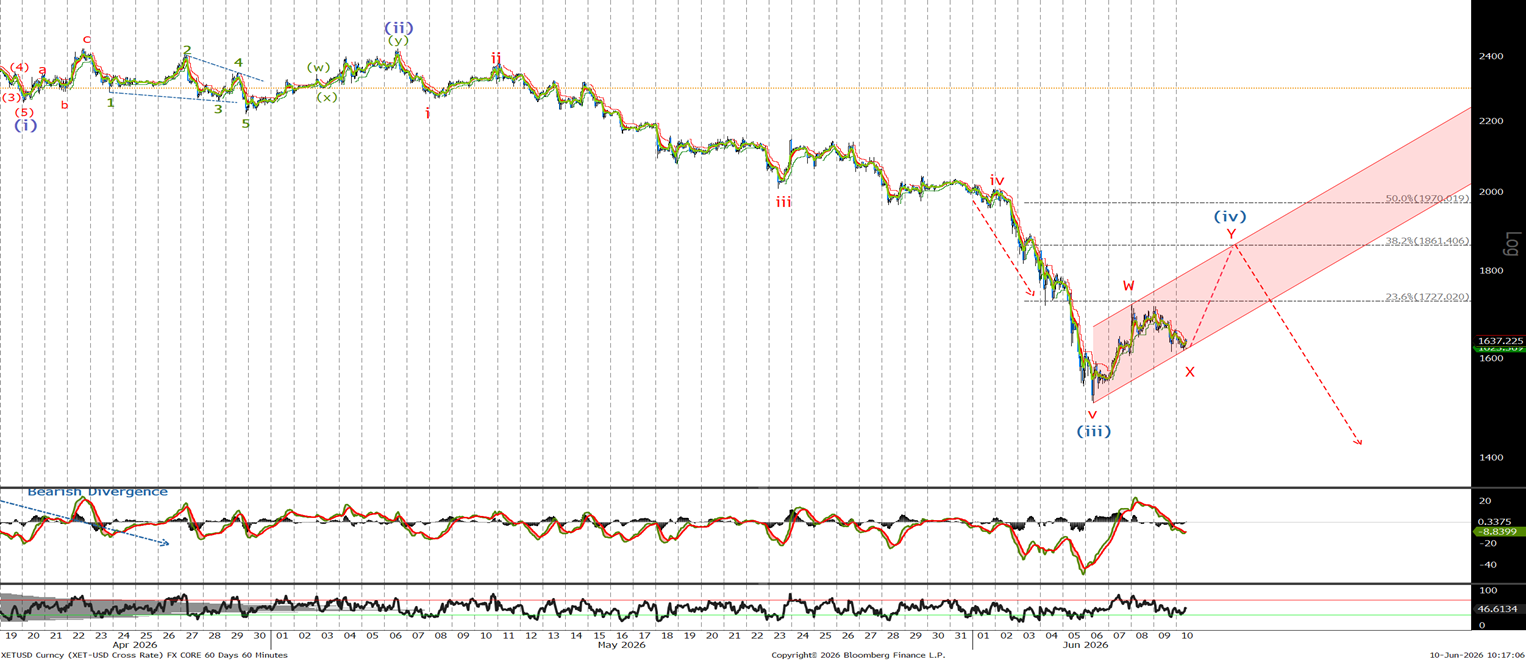
Last time we said ‘' The 1964 break saw an acceleration lower and, looking at the wave count once this current sell off complete wave (iii), we should see a correction enabling us to sell possibly back towards the 2000 level. I am therefore reducing my position and will add to shorts on this correction. However, I believe there is still further to go to the downside in the coming months.' We hit a low of”1505 and looking at the charts, it appears we are currently in the correction discussed last week. Look to sell around the 1860s and the 1970s level with stops above 2280 for another push to new lows.
Ethereum 15 Minute Chart
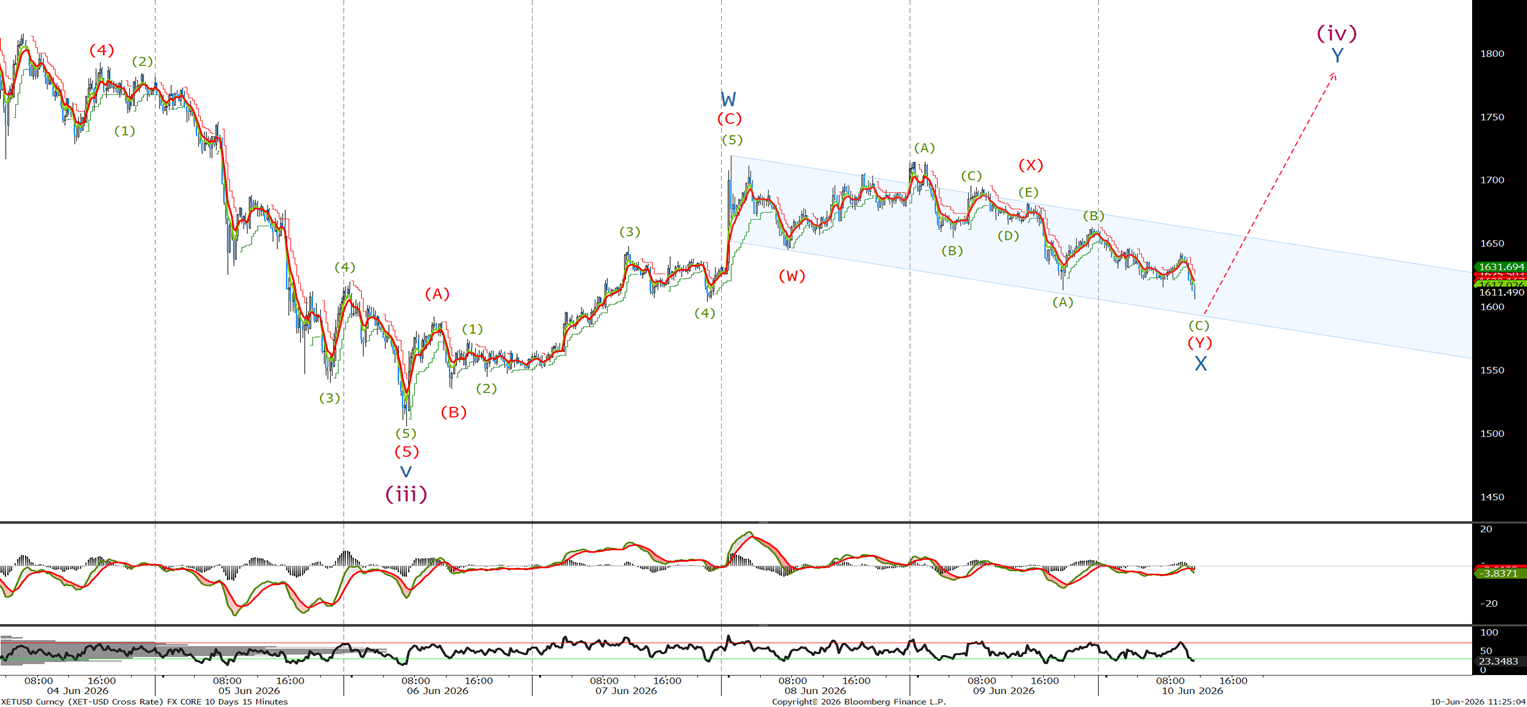
Looking at the 15-minute chart, it appears we are close to ending wave X, which should see a rally up to the levels previously mentioned. For a short term, trade, buy now at 1615 with stops below 1500. Look to take profits and go short towards the 1860 or 1970 level.
