Bitcoin Short Term Chart
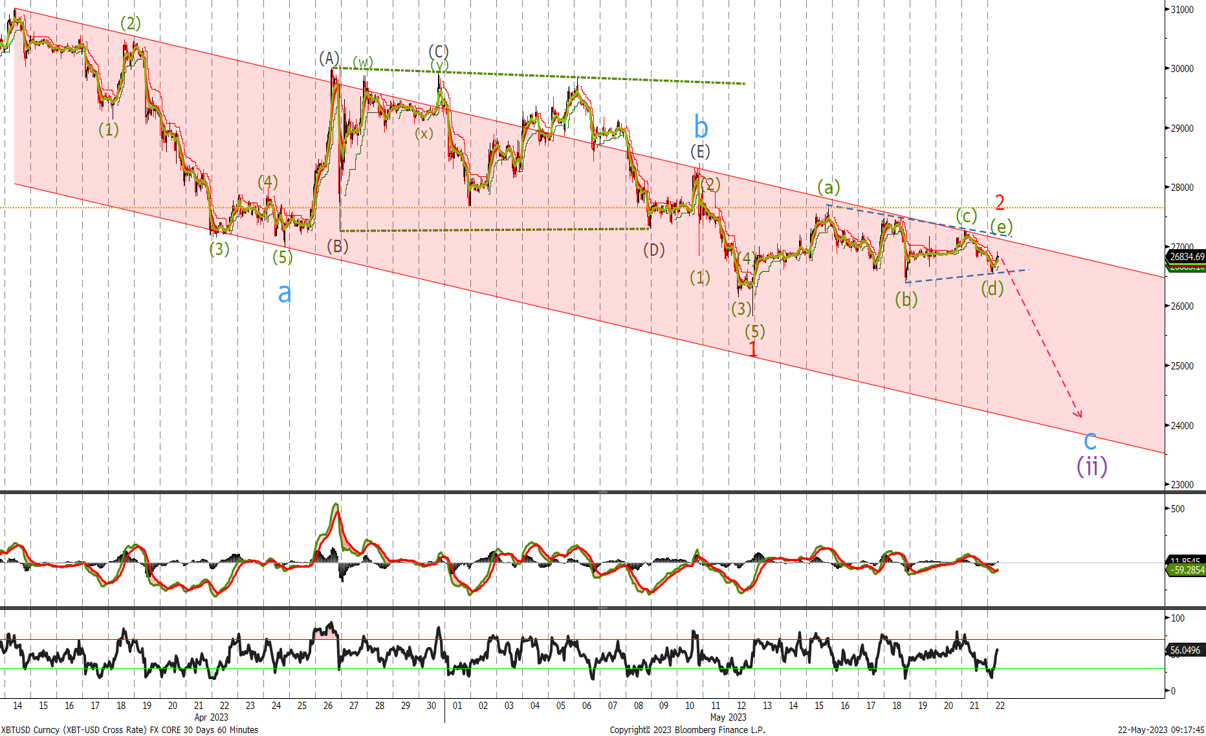
Despite recommending buying at $27'400 last week, I am closing my position now and will look to rebuy around the $24'300 level.
Given the sideways converging range bound price action (a corrective signal) of the last week, I believe we should see further consolidation followed by a break if the $26'300 level which should see an acceleration towards the bottom of the channel to complete 5 waves for wave C.
Wave A and wave C would be equal in length at $24'274 where we would look to start buying again.
Ethereum Chart
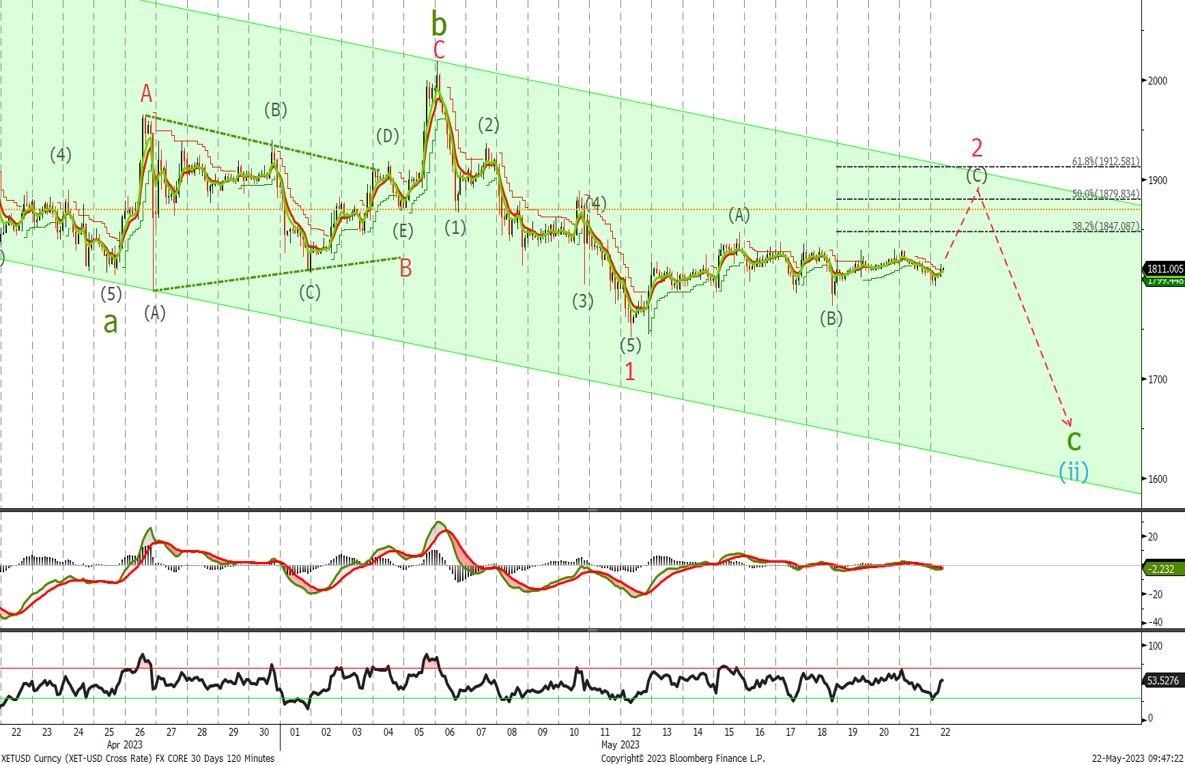
Like Bitcoin, Ethereum has traded sideways in a corrective nature and I am closing my longs now for a small loss. I think we will trade slightly higher towards the $1'880 level and the top of the channel from there, we expect to see another 3 waves lower toward the $1'660 level where wave c will be equal in length to wave a.
We would start buying down there with stops below $1'370. A move back above the $2'020 level will confirm the correction is over and we should see a sharp acceleration higher in wave (iii).
