
Bitcoin Short Term Chart
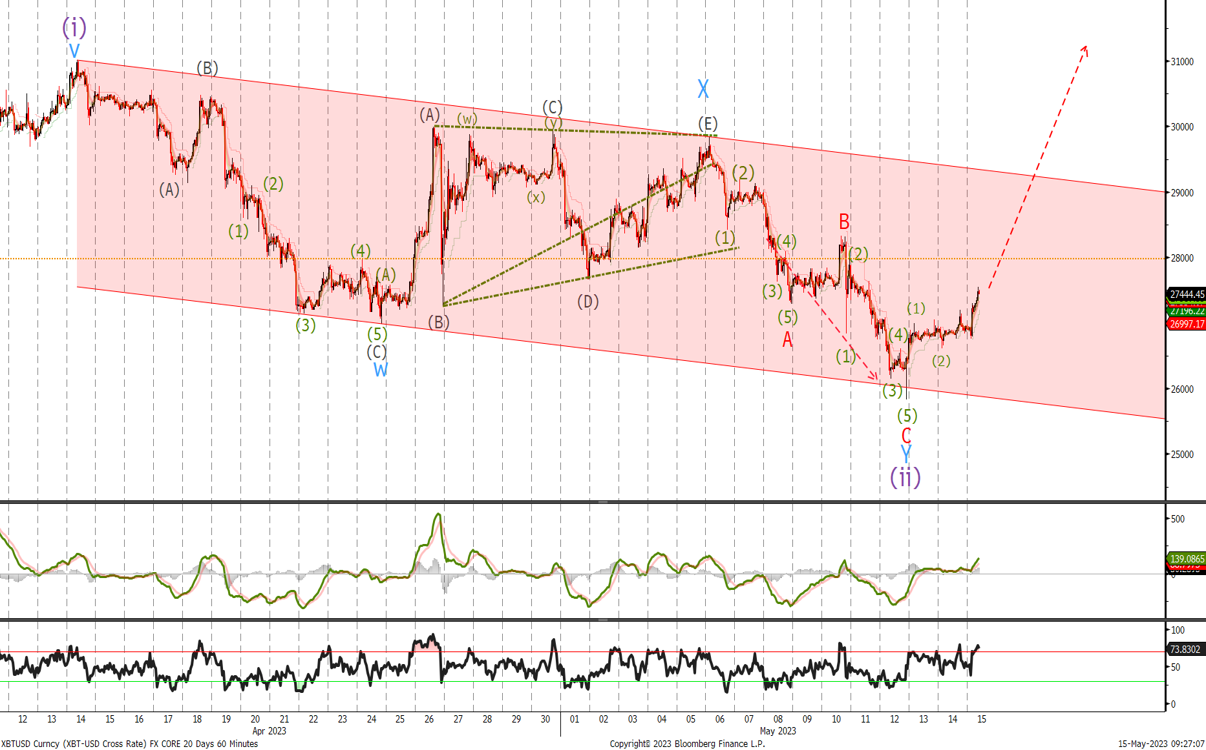
Last time we said:
Close shorts and go long at in the $25'188 – $26'536 area where we would start buying. Place stops below $23'000. Once wave (iii) gets underway we should see a sharp acceleration to the topside
We traded down perfectly in line with our expectations to the $25'828 level. We can raise stops to last week's low. If not long buy now at $27'400 with a move above the wave B high at $28'400 being the first barrier to break. Look for a sharp acceleration to the topside on a break out of the channel.
Ethereum Chart
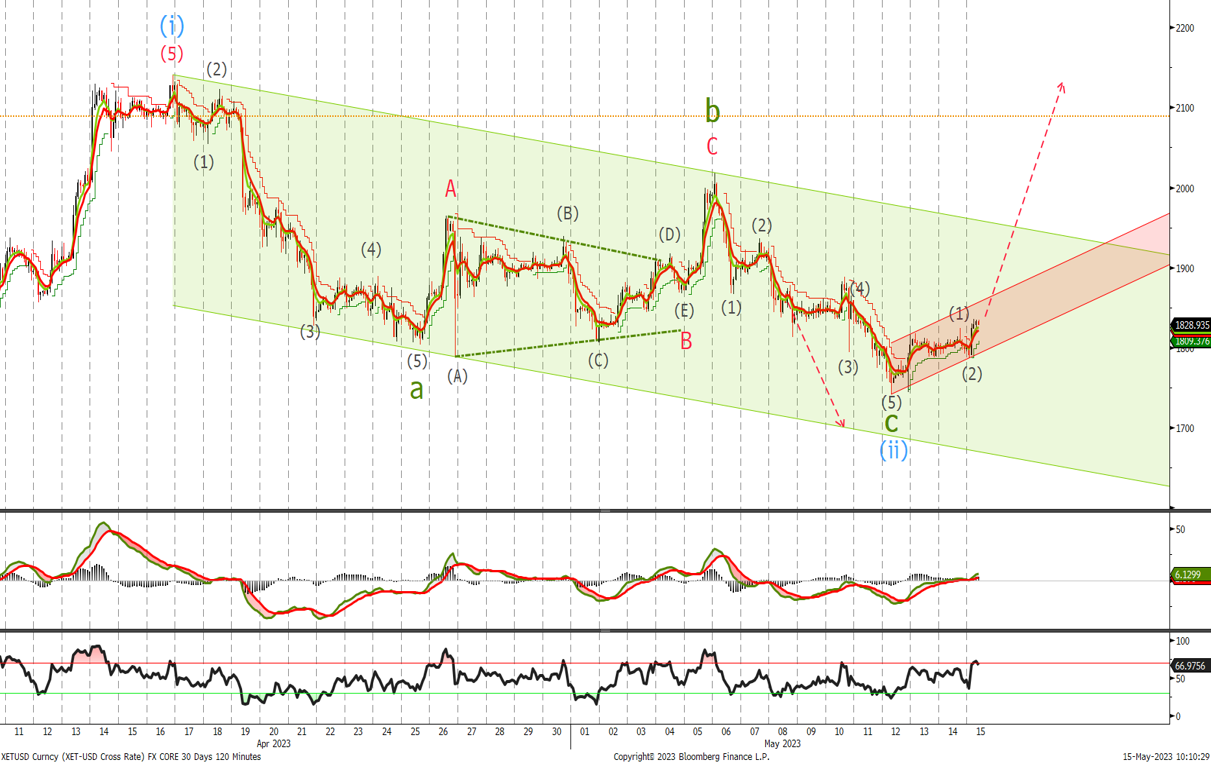
Last time we said:
Look to sell now at $1'865 with stops above $2'020 for a push toward the $1'650-$1'700 level where we would start to build a long position. Place stops on long positions at $1'590. We should see an acceleration higher on a break of the channel
We traded to $1'740 before reversing and if not already long close shorts now and buy at $1'840. If we haven’t seen the low look to add in the levels mentioned last week with stops remaining at $1'590. Once we break out of the channel, currently at $1'950 we can raise stops to the recent lows.
