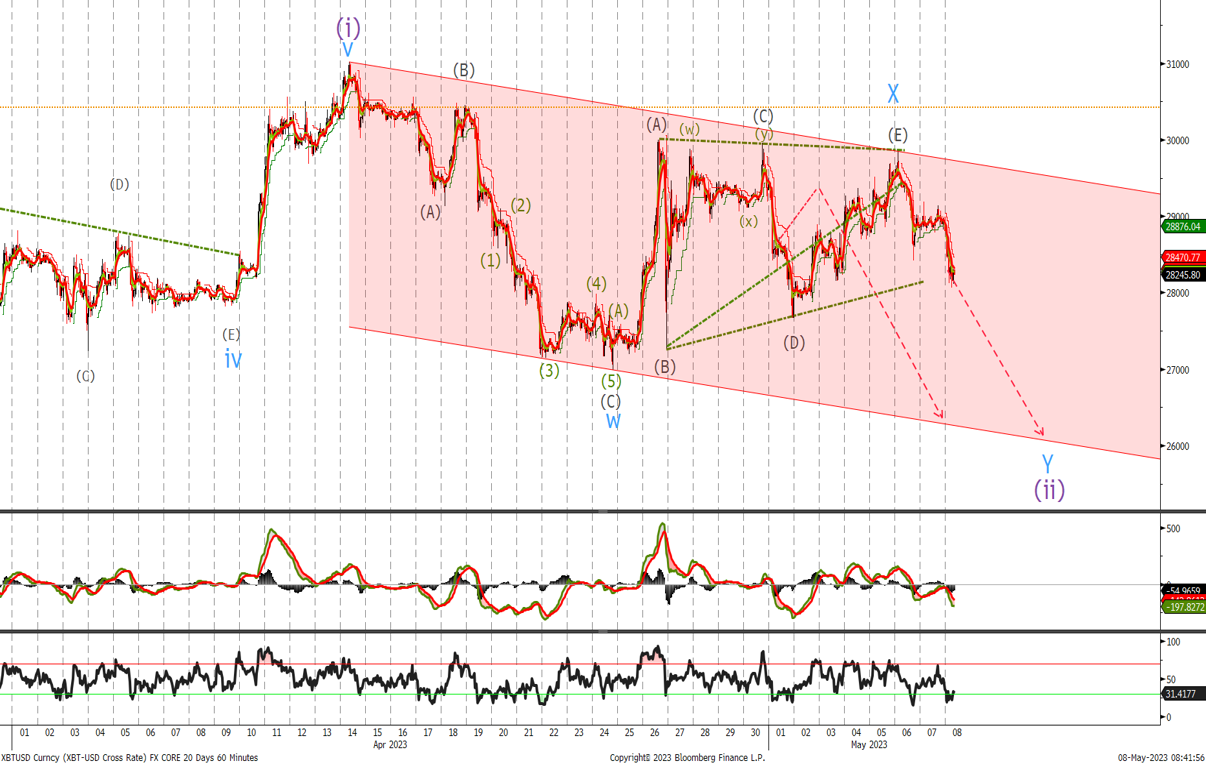
Bitcoin Short Term Chart
Last time we were said:
‘It appears that we are in the final stages of a corrective triangle given the range bound price action we have seen over the last 7 days. Look to sell around the $29'500 with stops at $30'500 for the wave Y lower. Close shorts and go long at in the $25'188 – $26'536 area where we would start buying. Place stops below $23'000. Once wave (iii) gets underway we should see a sharp acceleration to the topside’
We traded to $29'842 enabling us to get short. Use the level mentioned above as we trade down to the target levels and the bottom of the channel.
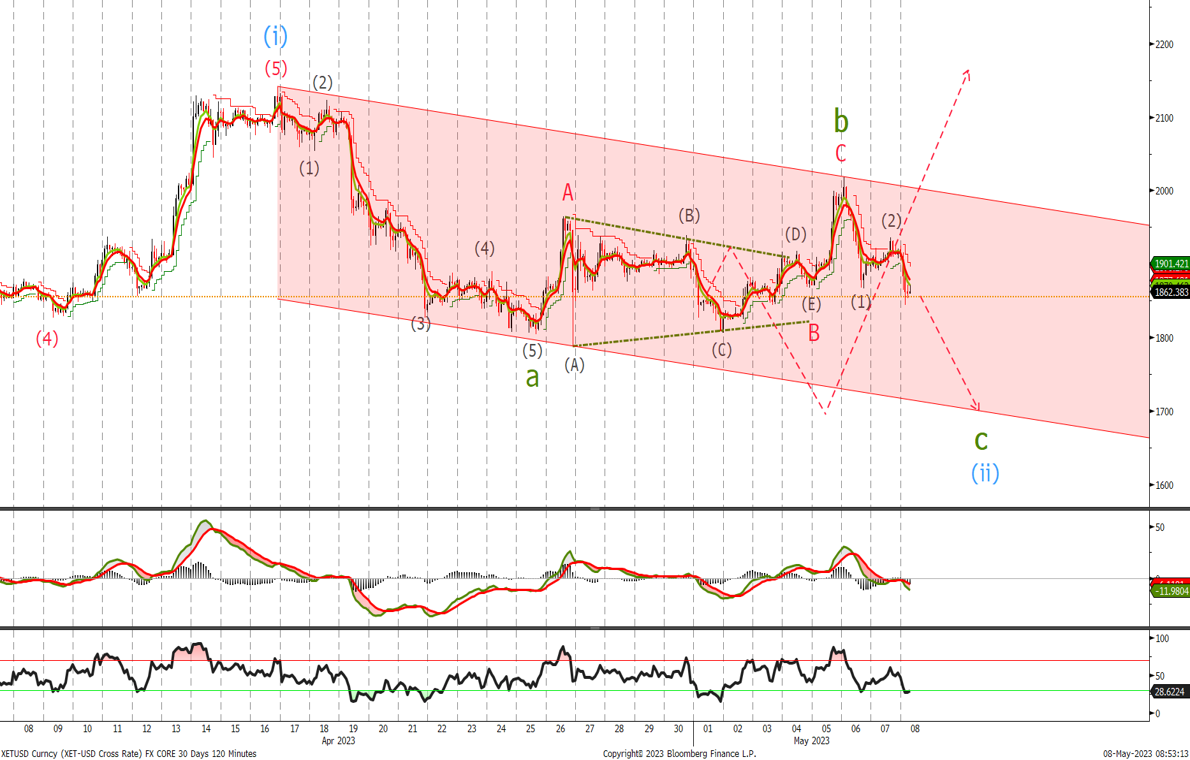
Ethereum
Last time we said:
‘Given the sideways price action I believe we are close to completing wave b before one final push lower that should end above our $1'670 stop loss level’
Admittedly I was looking for a triangle formation but we didn’t trade high enough to negate the above view. Look to sell now at $1'865 with stops above $2'020 for a push toward the $1'650-$1'700 level where we would start to build a long position. Place stops on long positions at $1'590. We should see an acceleration higher on a a break of the channel at the $2'020 level.
