
Bitcoin Short Term Chart
Last time we were looking for a break higher and believed:
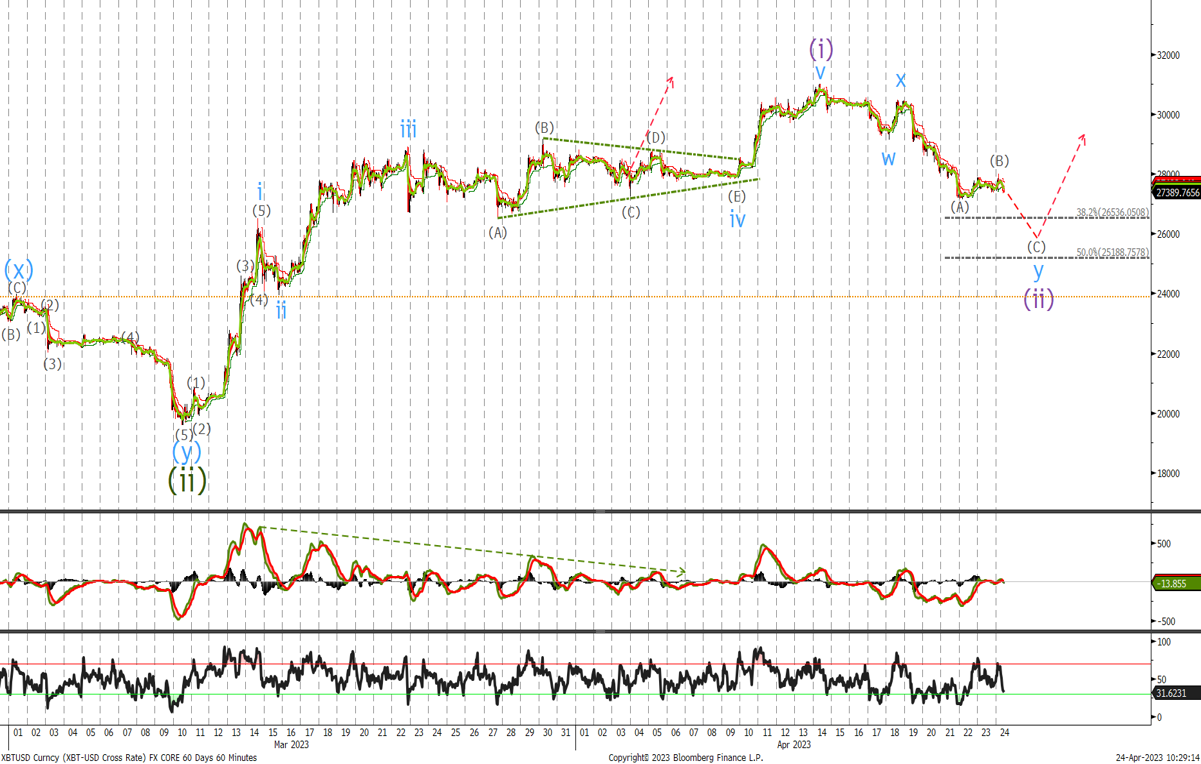
‘A break above $30k will see short covering on the futures and should see an acceleration towards $35k level’
We traded to $30'998 before selling off over the last 2 weeks. I have adjusted the count to show wave (i) completed at $30'998 and wave (ii) is currently tracing out. Breaking the sell off down we expect another push into the $25'188 – $26'536 area where we would start buying. Place stops below $23'000. Once wave (iii) gets underway we should see a sharp acceleration to the topside with confirmation on a move back above $30'500.
Ethereum
Last time we said:
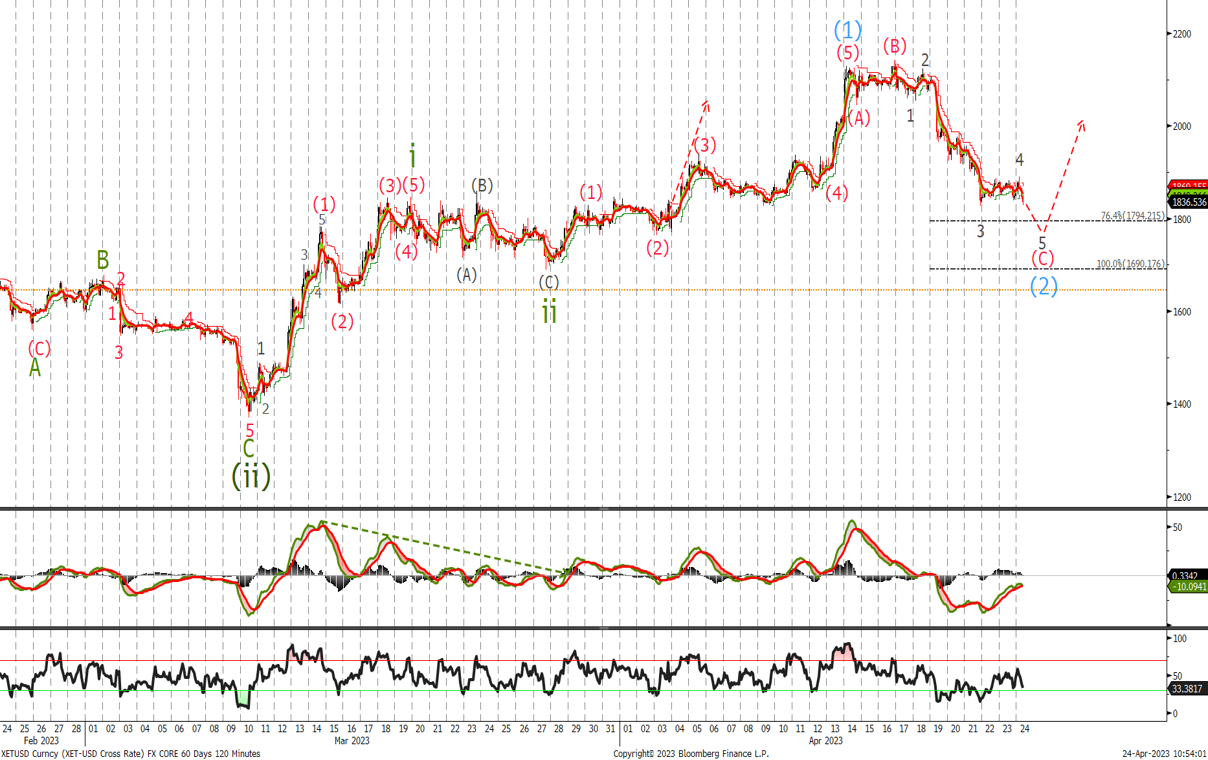
‘If not long buy now, currently at $1'810, and raise stops to $1'670’
I believe that wave 4 of C is still unfolding and should see a final sell off into the $1'795 area to complete 5 waves down where we would start to buy with stops remaining at $1'670. A break below $1'670 would negate the count and we would need to reassess the current position of ETH.
