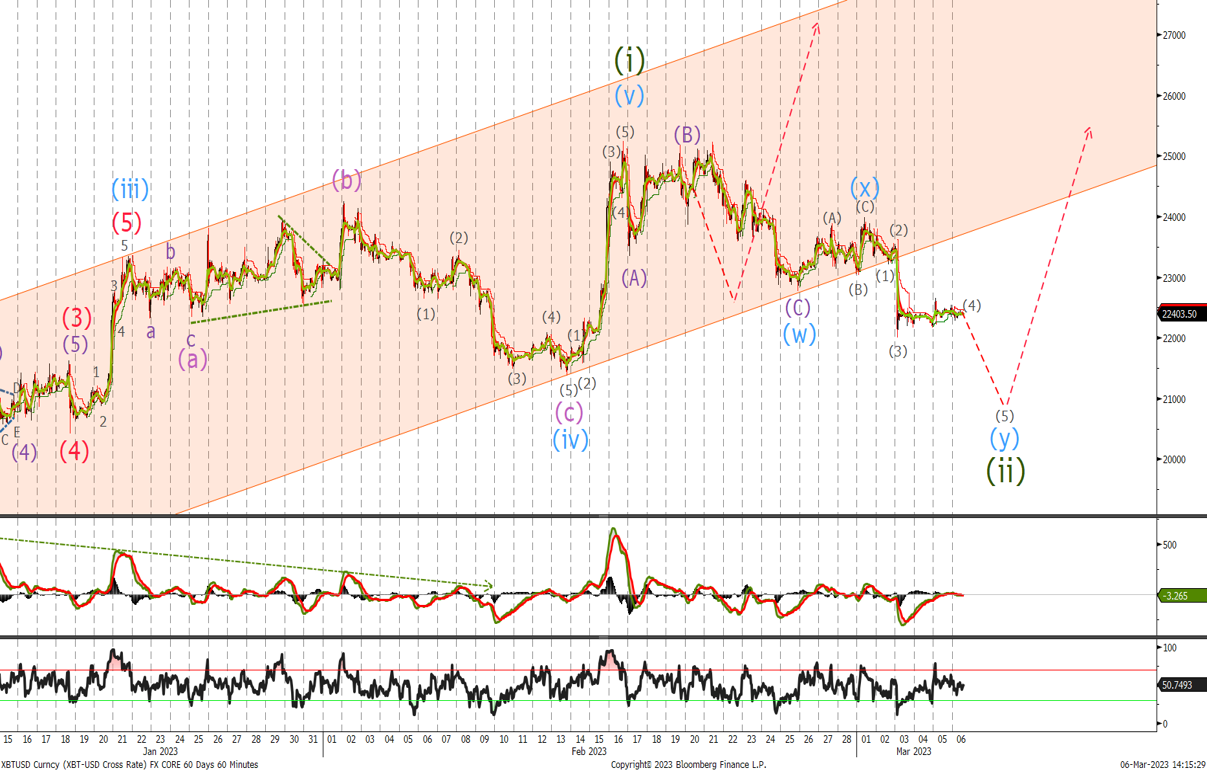
Bitcoin
Last time we were looking for a correction before higher. As you can see from the chart we dropped out of the channel and further than expectations.
We said last time:
Look to buy at the $22'900 and add at the $22'300. Place stops for short term trades below $20k
Given the depth of the pull back I have relabelled the chart to say wave (i) completed in the middle of Feb. and we are now correcting in wave (ii) that might take us below last weeks stop levels. I would lower stop loss levels to below $18'900 and look to add to longs at $21'415, $20'283 and $19'200.
Once this correction is complete I expect a sharp acceleration higher in wave (iii).
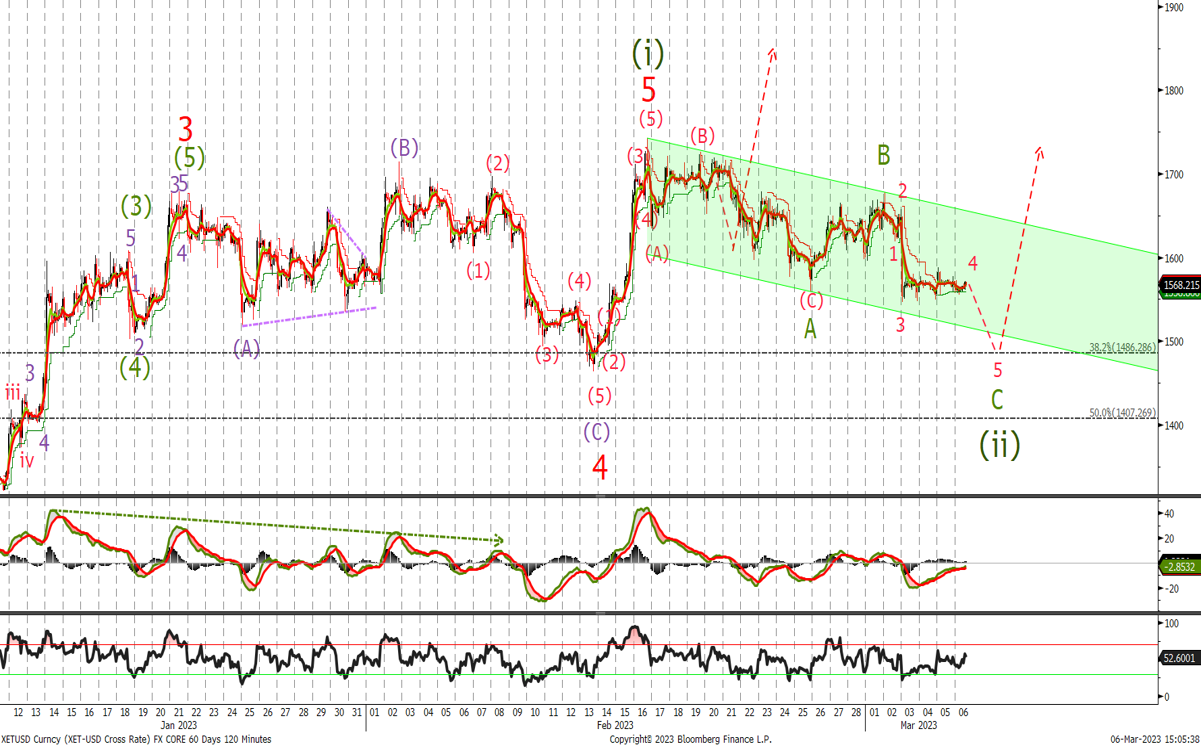
Ethereum
Last time we were looking for a correction before higher, and the sell off from the highs has taken longer and further than I was expecting. We bought from last weeks level at $1'602 and $1'570 so remain long.
However I changed the count and this allows for the possibility of a deeper correction before wave (iii) get underway. This will give us the opportunity to buy at $1'486, the 38.2% retracement level and the bottom of the channel but with a possibility even lower at $1'407. Lower stops now to $1'333. A move above $1'690 indicates the next leg higher is underway.