Bitcoin Long Term Chart
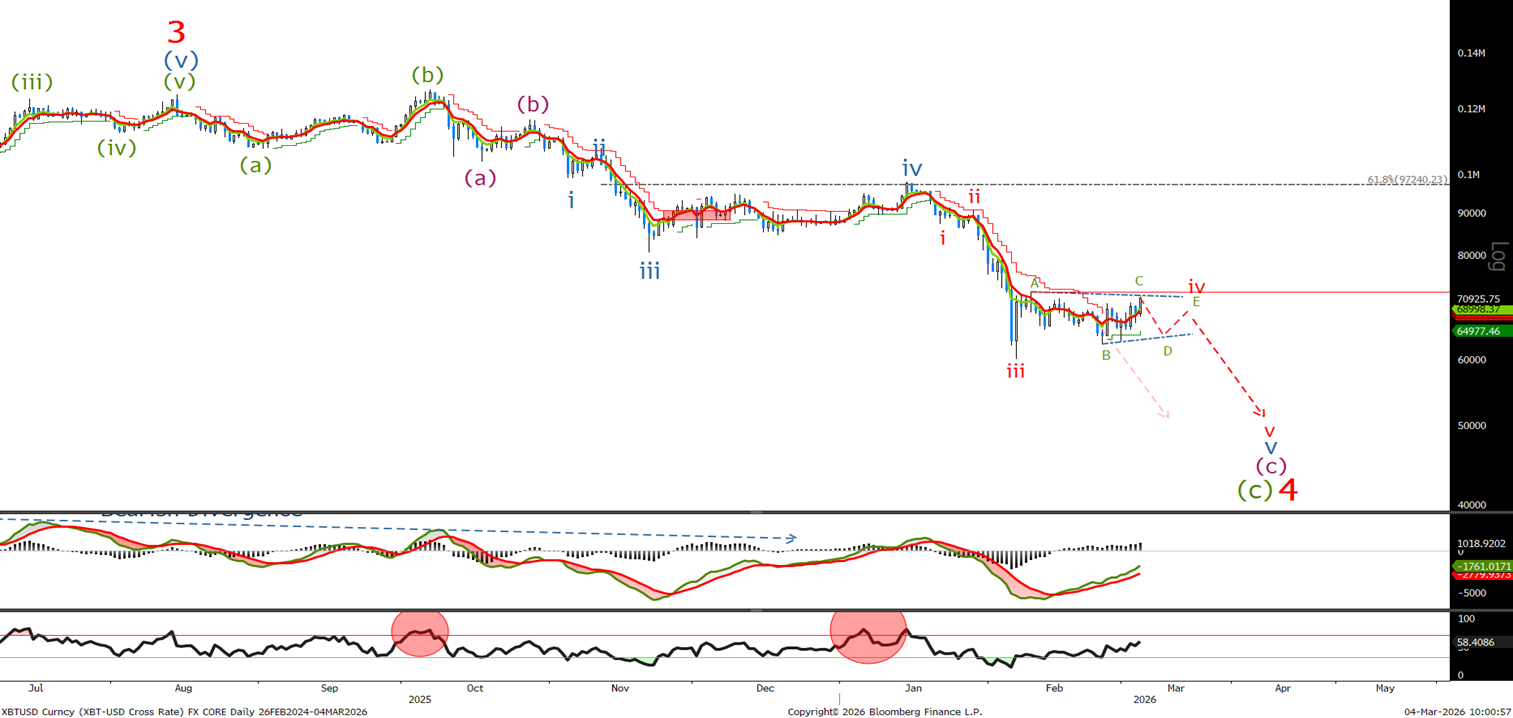
Last time we said ‘We range traded in what I am now calling a wave iv triangle correction.’ The correction appears to be on going and if we are in a triangle we should turn down below the 72K level. A break above does not negate the bearish view with a larger zigzag correction taking place but I will update the charts if that occurs.
Bitcoin Short Term Chart
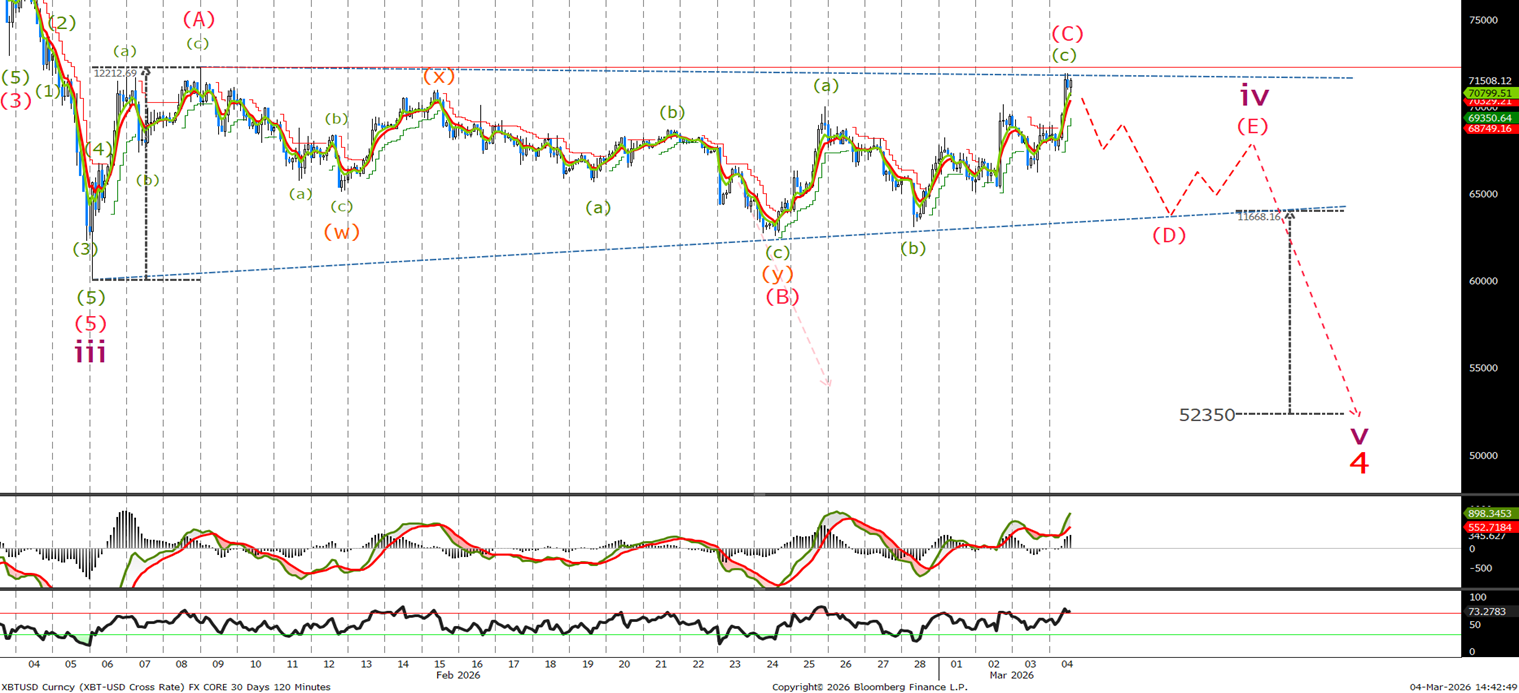
Last time we thought we had already broken out of the triangle and said ‘. Wave IV triangles often travel the same distance as the depth of the triangle on breakout. We will look for a sell-off in 5 waves towards that level, followed by a test of the 50k level depending on the strength of the upcoming sell-off. This will provide us with an excellent buying opportunity. Since then, as you can see, we have traded higher into 3 waves , that either represent wave (c) of a triangle as shown, or, wave (c) of a zigzag. If we turn from current levels, then the eventual breakdown lower should target the 52350 area now.
Ethereum Long Term Chart
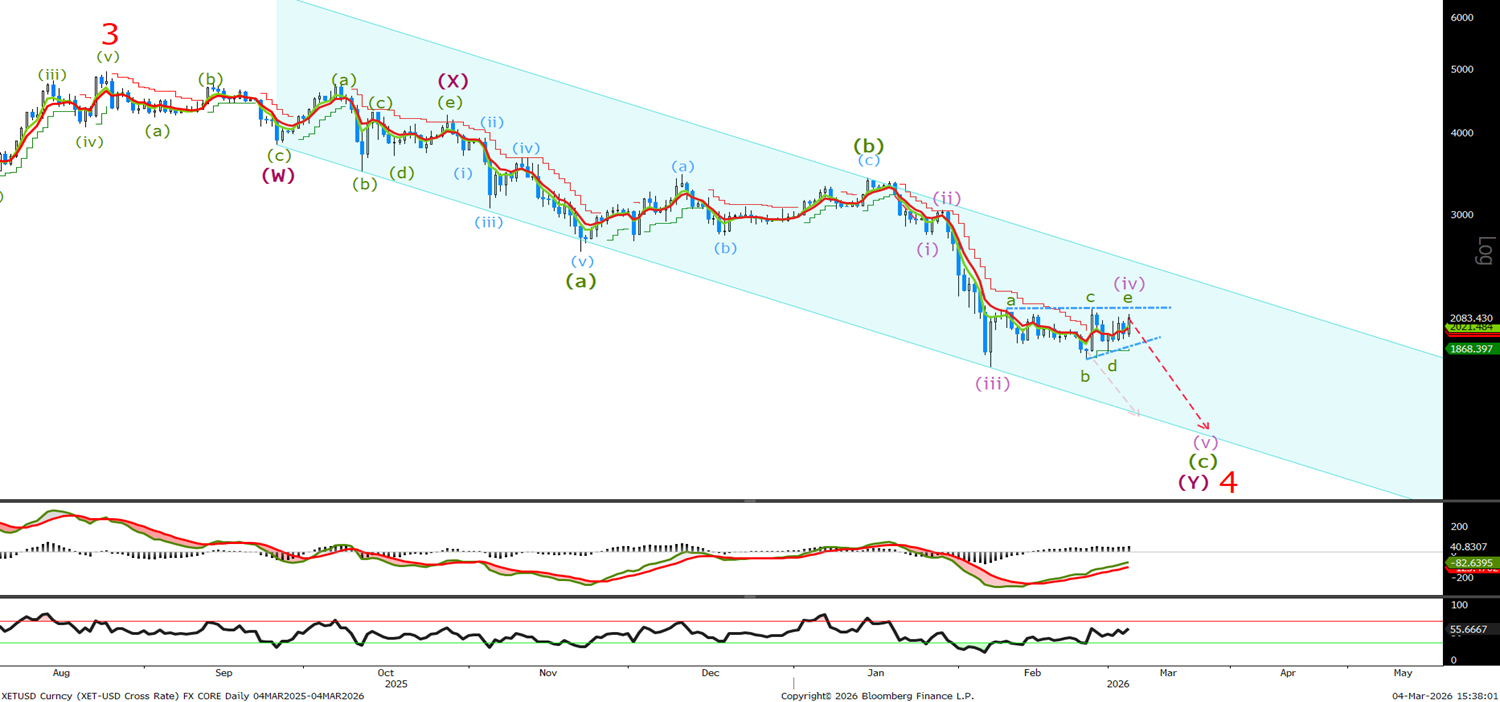
Last week I called the end of the corrective triangle as we continue to range sideways. This adds confidence to the bearish view as the end of the trend usually ends in a sharp reversal and this just feels corrective. There is a possibility of a zigzag correction and a move up towards the top of the channel at the 2500 level, but over all we are still looking for a final push to new lows before the bull trend resumes.
Ethereum Short Term Chart
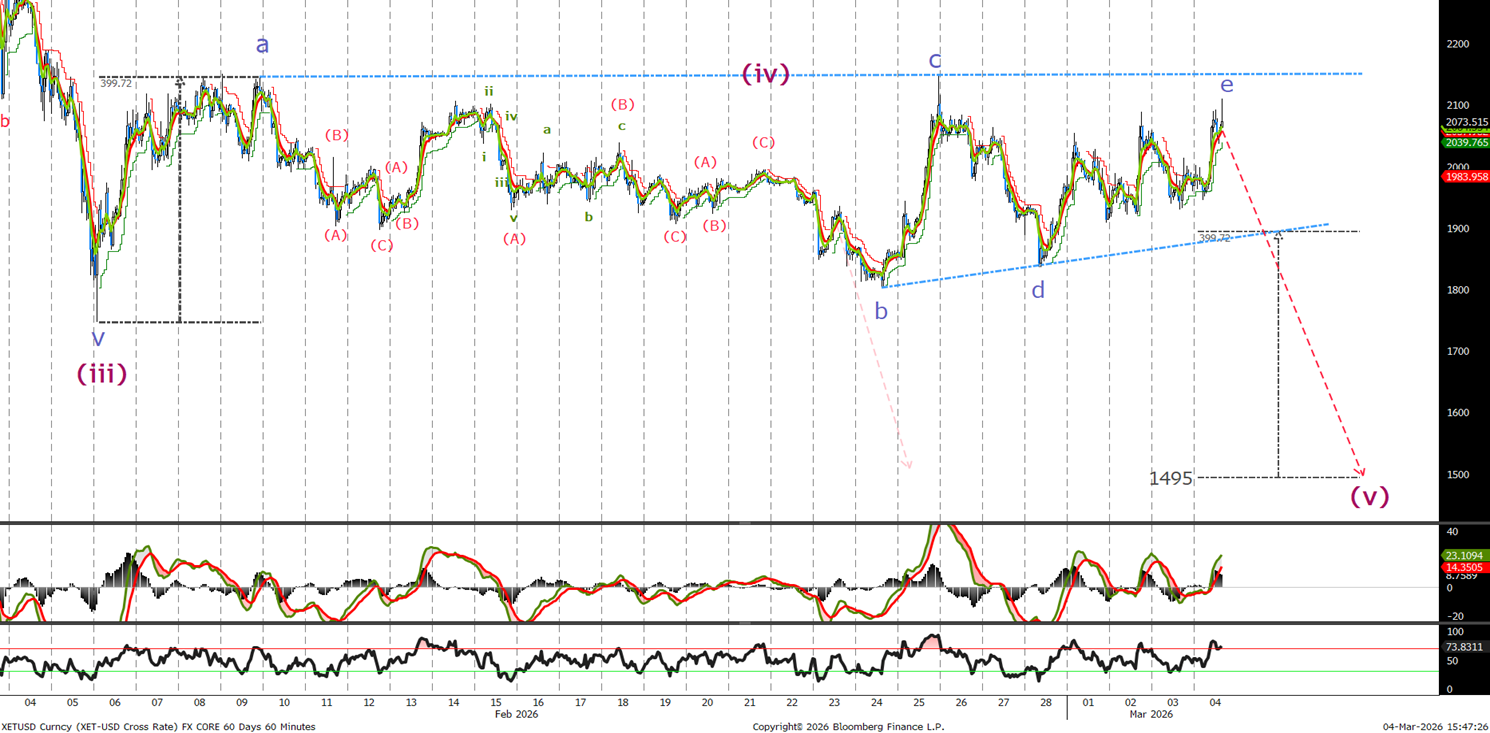
I have changed the short term chart to show the extended triangle correction. I am still looking for lower with a confirmation on a break below 1840. Given the price relationship with a wave 4 triangle break, targets are around the 1500 level to complete the long term correction, providing us with a great buying opportunity before new all time highs.