
Bitcoin Weekly Chart
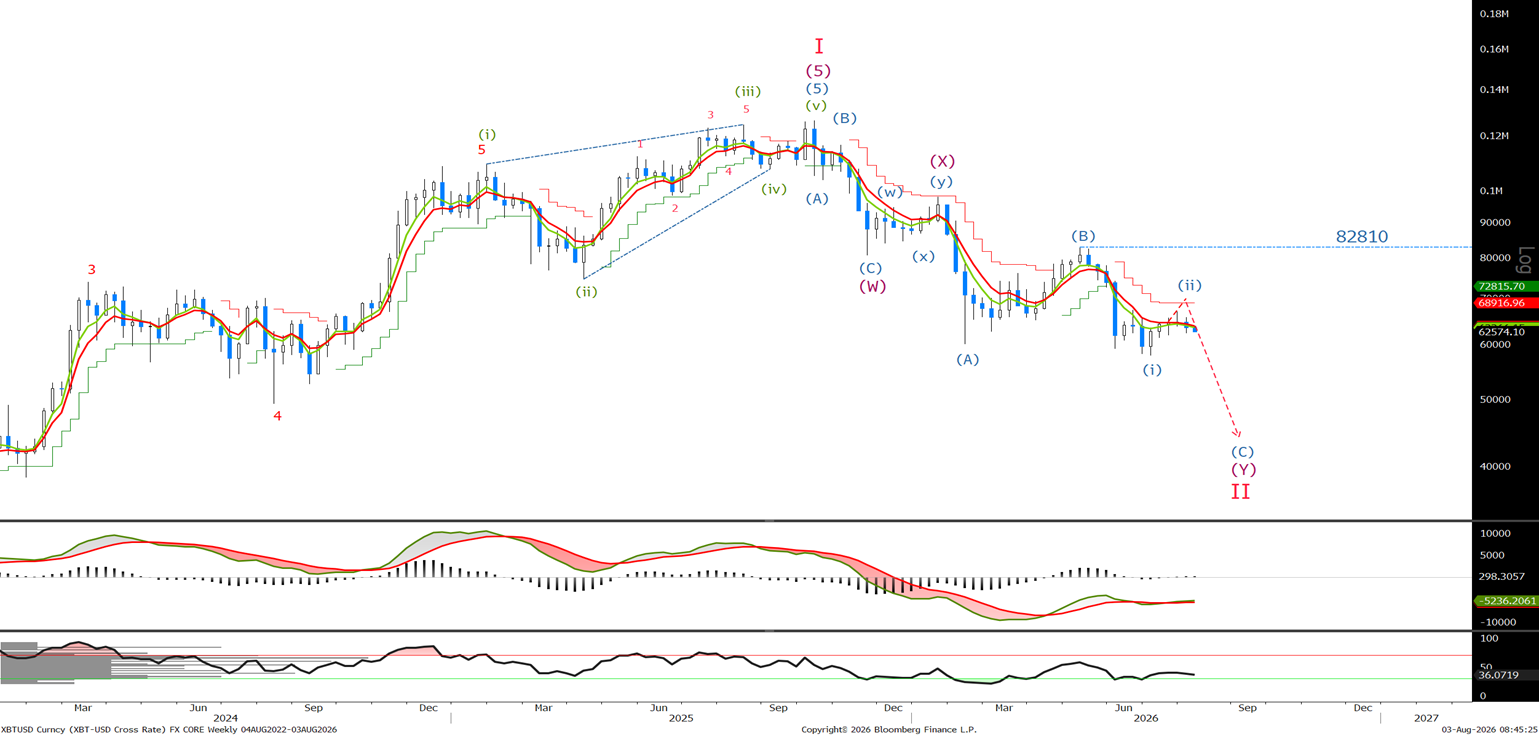
Last week we called the end of the wave (ii) correction and whilst below 66923 on a weekly basis, we will look to sell rallies.
Bitcoin Daily Chart
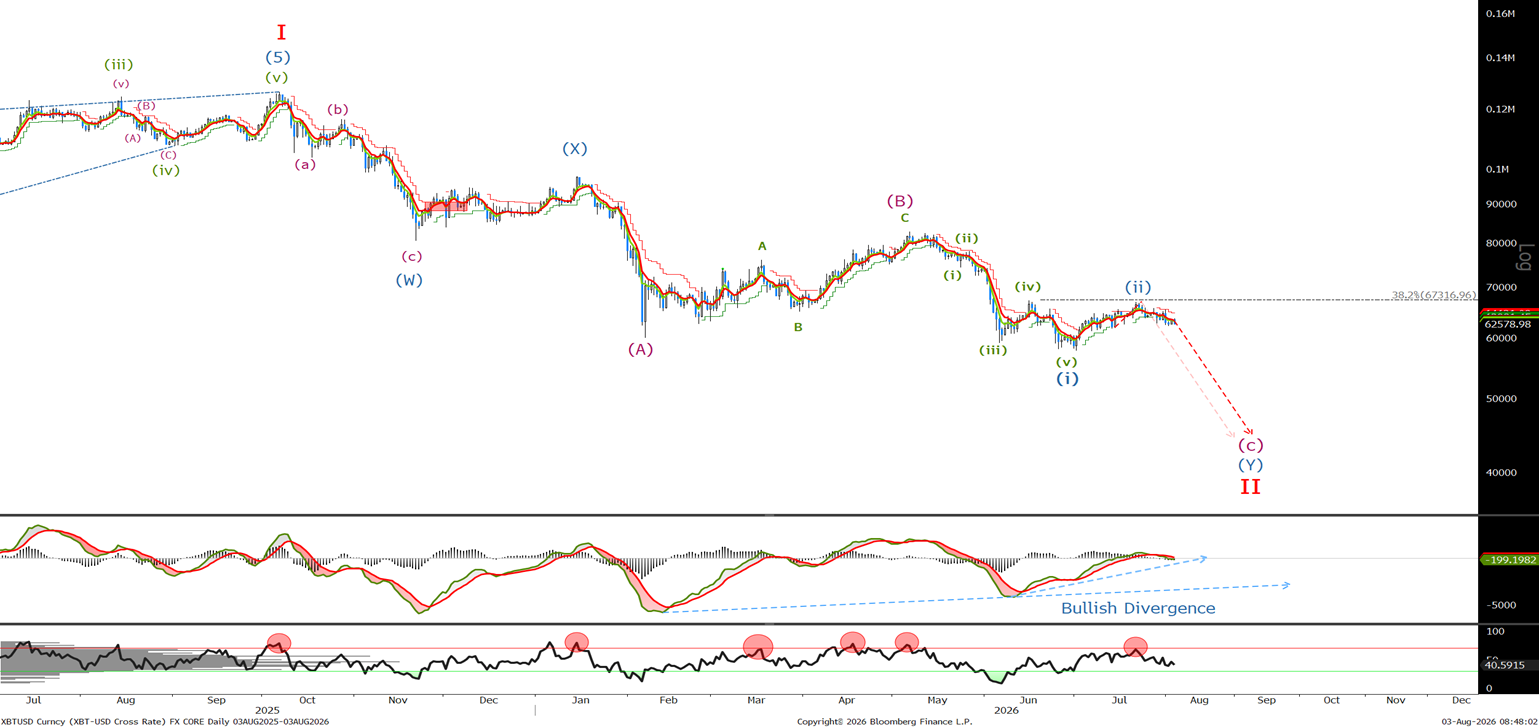
Little changed on a daily basis as we await an acceleration to the downside. A daily close below 62k should confirm that wave (iii) is underway.
Bitcoin Short Term Chart
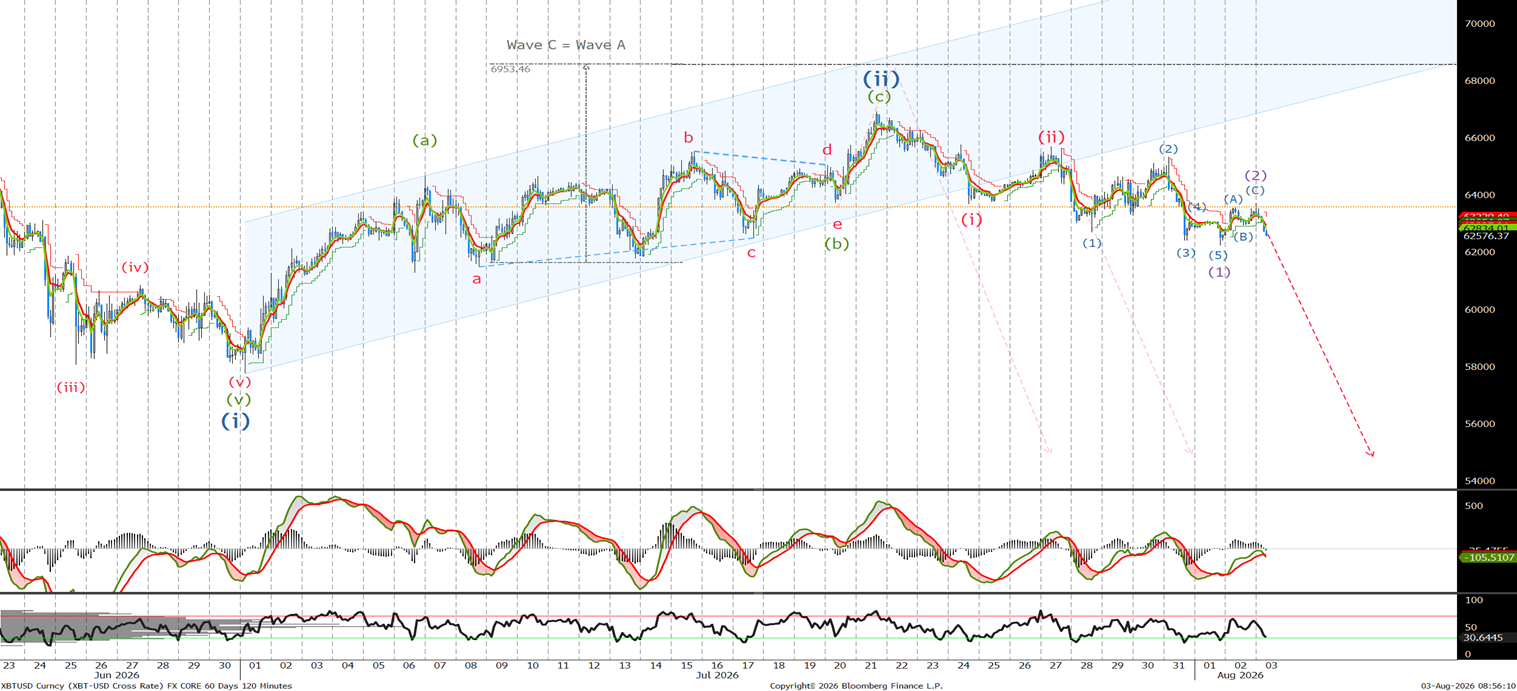
Last time I said, ‘I am selling now at 63450 for a small profit from last week and going short with stops at last week's high of 66923.' We have continued to make lower lows and lower highs, so if the wave count is correct we should see an acceleration lower with break below the wave a low at 61.5K should see a sharp drop. I am happy to sell now at 62.5K with stops at 65.7k or preferably remaining at last week's level.
Ethereum Long Term Chart
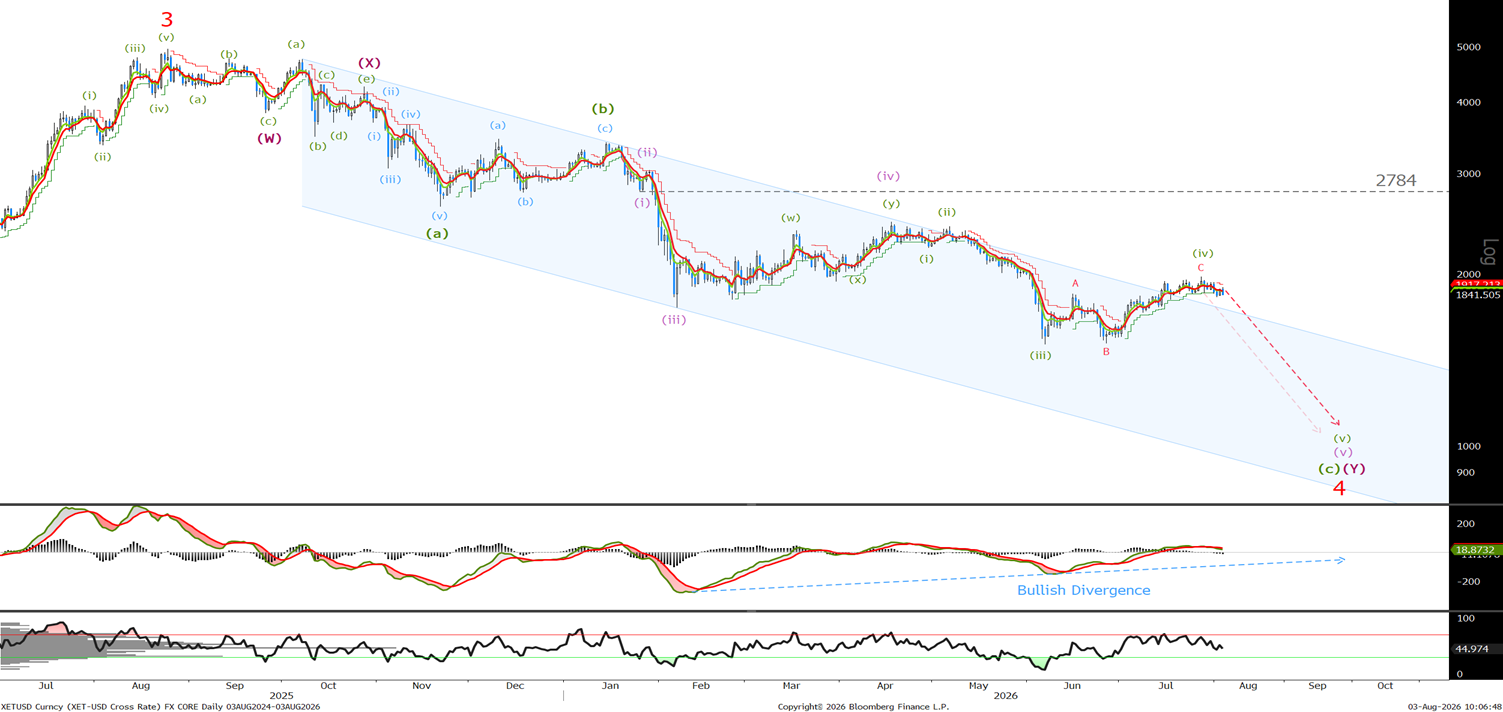
No change on the daily ETH as we continue to look for lower whilst below 1979. If not short sell now at 1840, with stops above last month's high.
Ethereum Short Term Chart
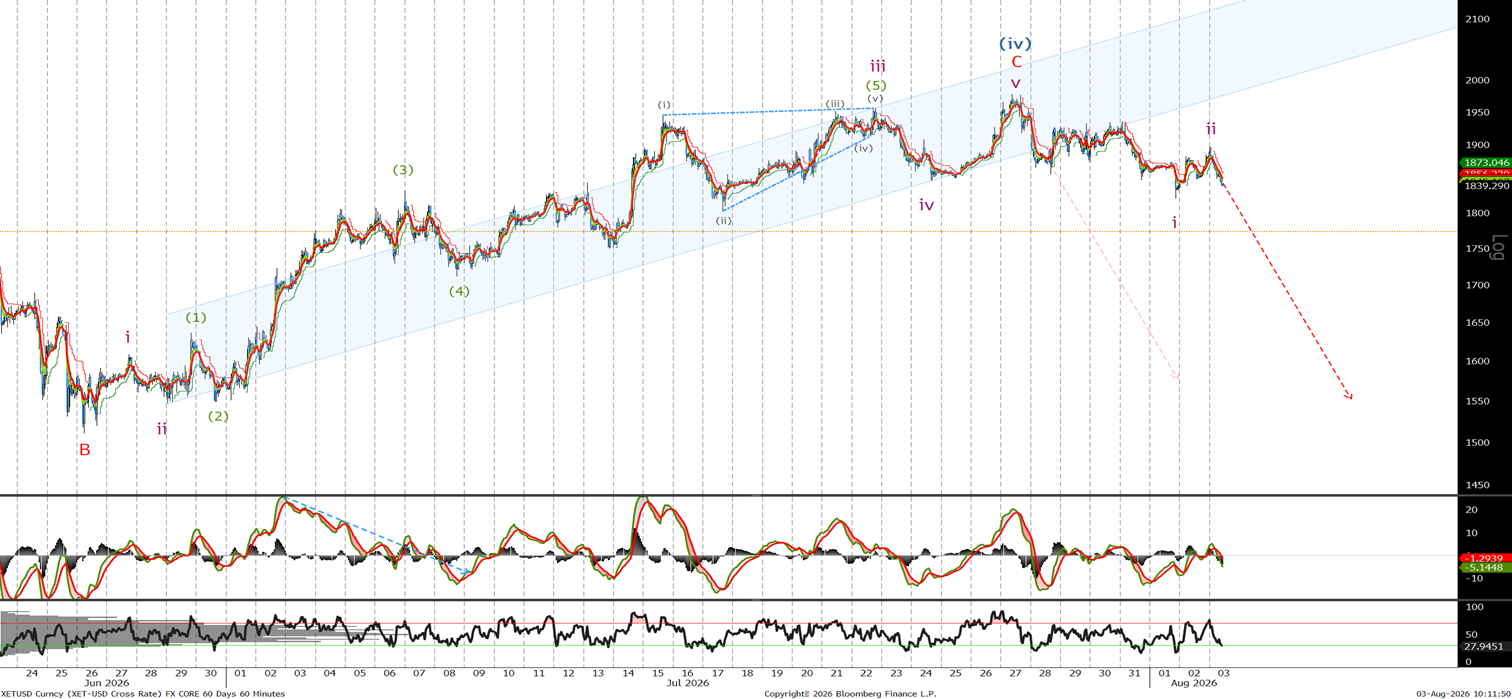
Last time we said, ‘I am looking to sell at 1900 with stops above 1950 or on a break below the wave (1) at 1803.’ The high was 1978, stopping us out, but given the sell-off in the last 24 hours, I am happy to sell now at 1880 with stops 100 dollars higher.
Ethereum Very Short Term Chart
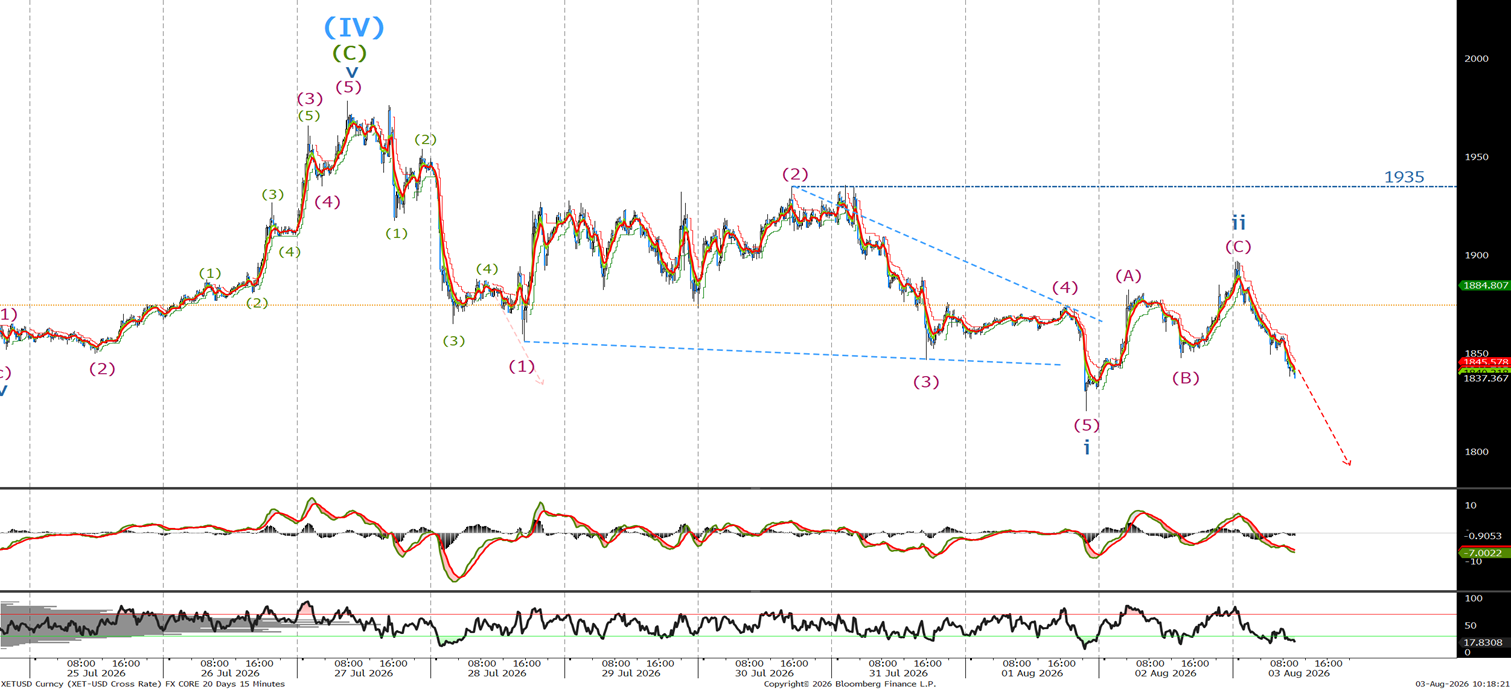
Last week in the 15-minute chart, I said 'we continue to make lower lows and lower highs, and I am happy to sell now at 1880, 1900 and again at 1920 with stops at 1956 or 1980.' We traded up to 1935, enabling us to sell at an average rate of 1900. If not short sell now at 1835 with stops 100 pips higher. Theoretically, we should not break this morning's high and the 1900 level.