Bitcoin Long Term Chart
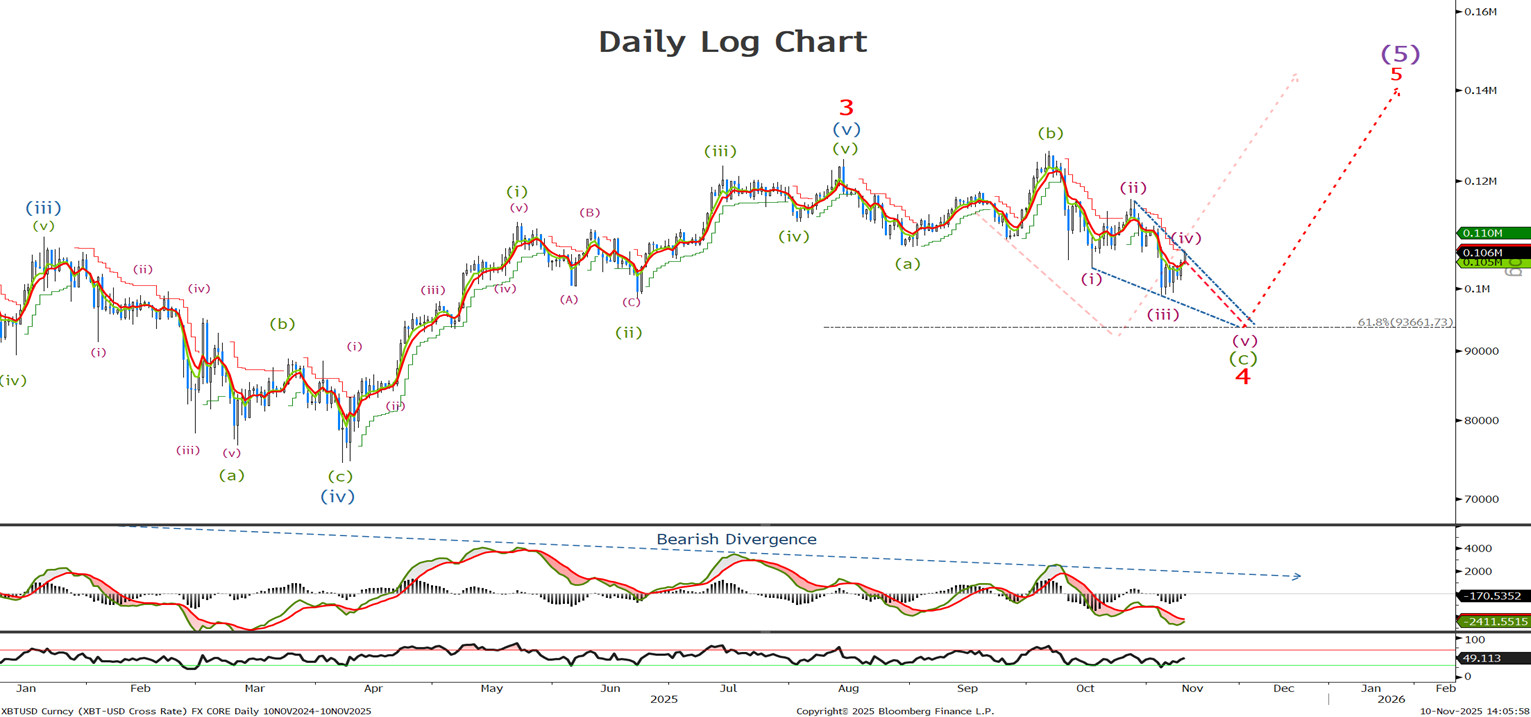
Last time we said ‘as I type this we are testing the 103.6k level. If we break then I expect to see a push down to test the 99.5-100K level or possibly lower to the 93.6K retracement levels , but we need to look to see the short term price action for an idea where we are in the current wave (c). Long term nothing has changed and we will use this correction to add to tongs before wave 5 to new highs gets underway.’ It appears to have traced out 4 of the 5 waves so I expect to see 1 final push lower.
Bitcoin Short Term Chart
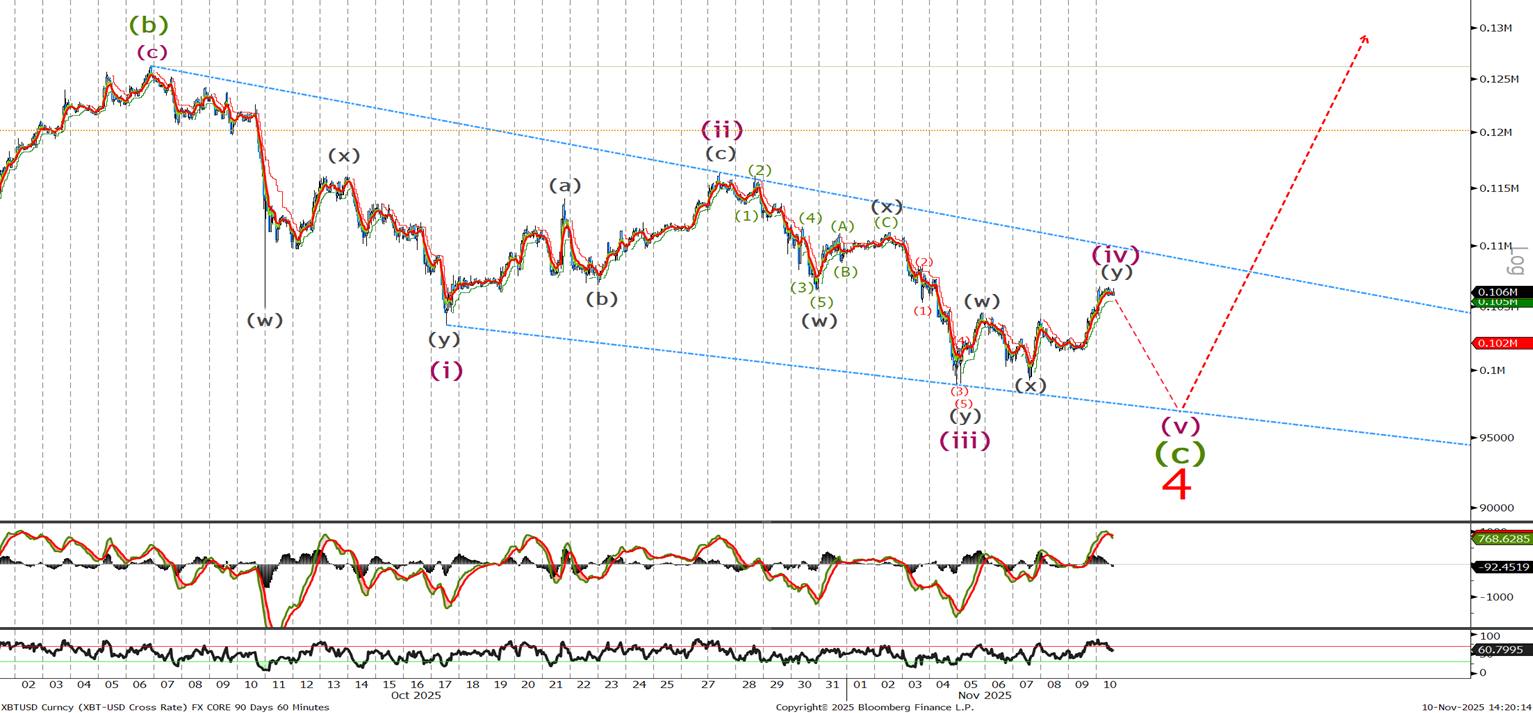
Last time we said ’ we should now sell off in 5 waves. I believe we will see a push past the 99.5 level and I will look to add at the lower 96K level and look to see the price action for signs of a completion’. The low so far for 98913 , so we have not bought yet and since then it has retraced in 3 waves to 106.6k . I expect to see a sell off below the recent low and will look to sell on any rallies to 112k with stops above 116.5 for a push towards the bottom of the channel , looks for bearish divergence in the MACD for hints that a low is in.
Ethereum Long Term Chart
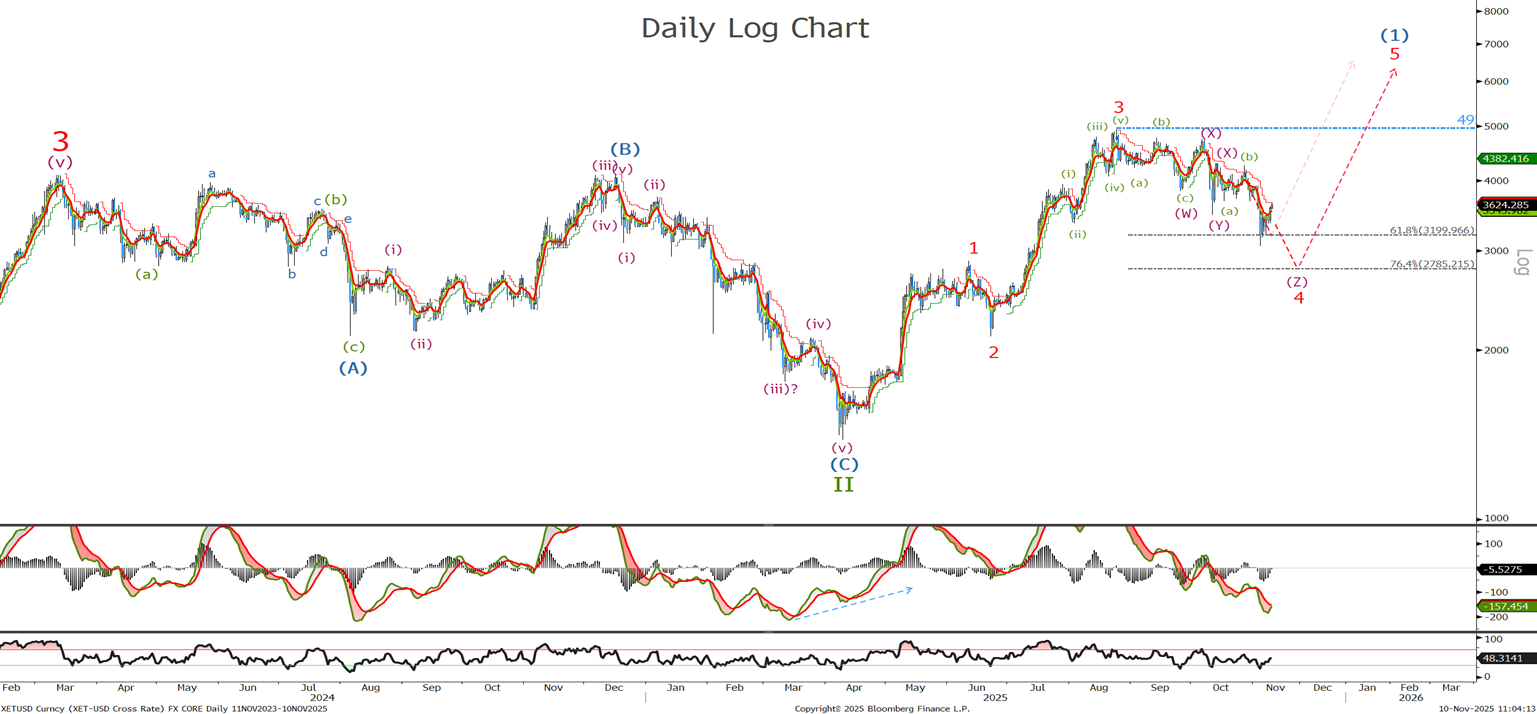
Last time we were looking for the end of wave (Z) before a rally to new highs. Given we have sold off inline with the last update and have since corrected off the lows we need to break the wave (Z) down in the short term to see if the correction is over and if we should buy now or lower possible buy areas.
Ethereum Short Term Chart
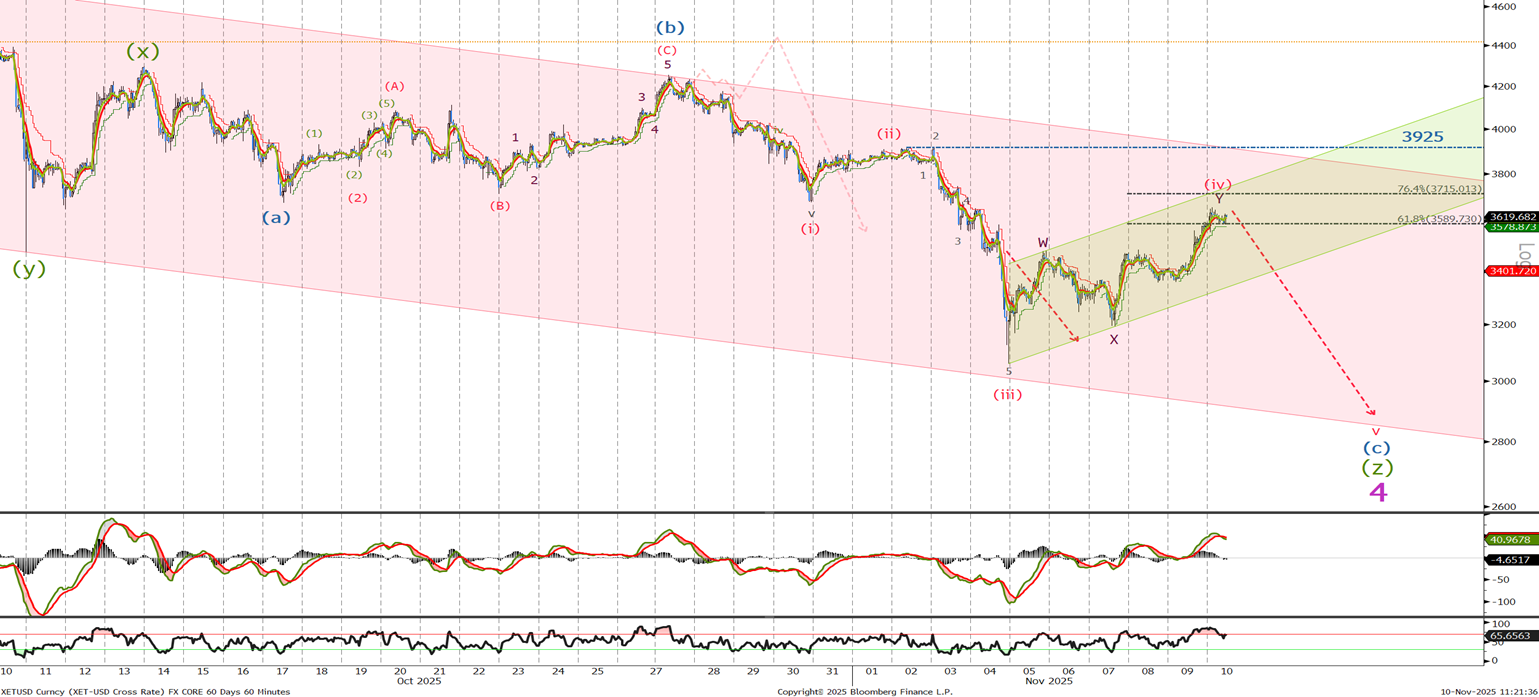
Last time we said ‘I expect to see a push lower to the 3200 level and depending on the weakness a test of the 3000 level.’ We traded to 3059 before what is a clear 3 wave retracement. Given the wave count I am happy to start selling here and will add to shorts at 3715 with a stop and reverse above 3925 looking for the push back below 3000 to test the 2922 level before support around the bottom of the channel at 2800.
