
Bitcoin
Last time we said :
I am selling my position and going flat with an argument that BTC might also get caught up in the ETH merge. I would buy on a move back above 25300 , with a move below 17600 implying that another 3 waves lower is underway.’
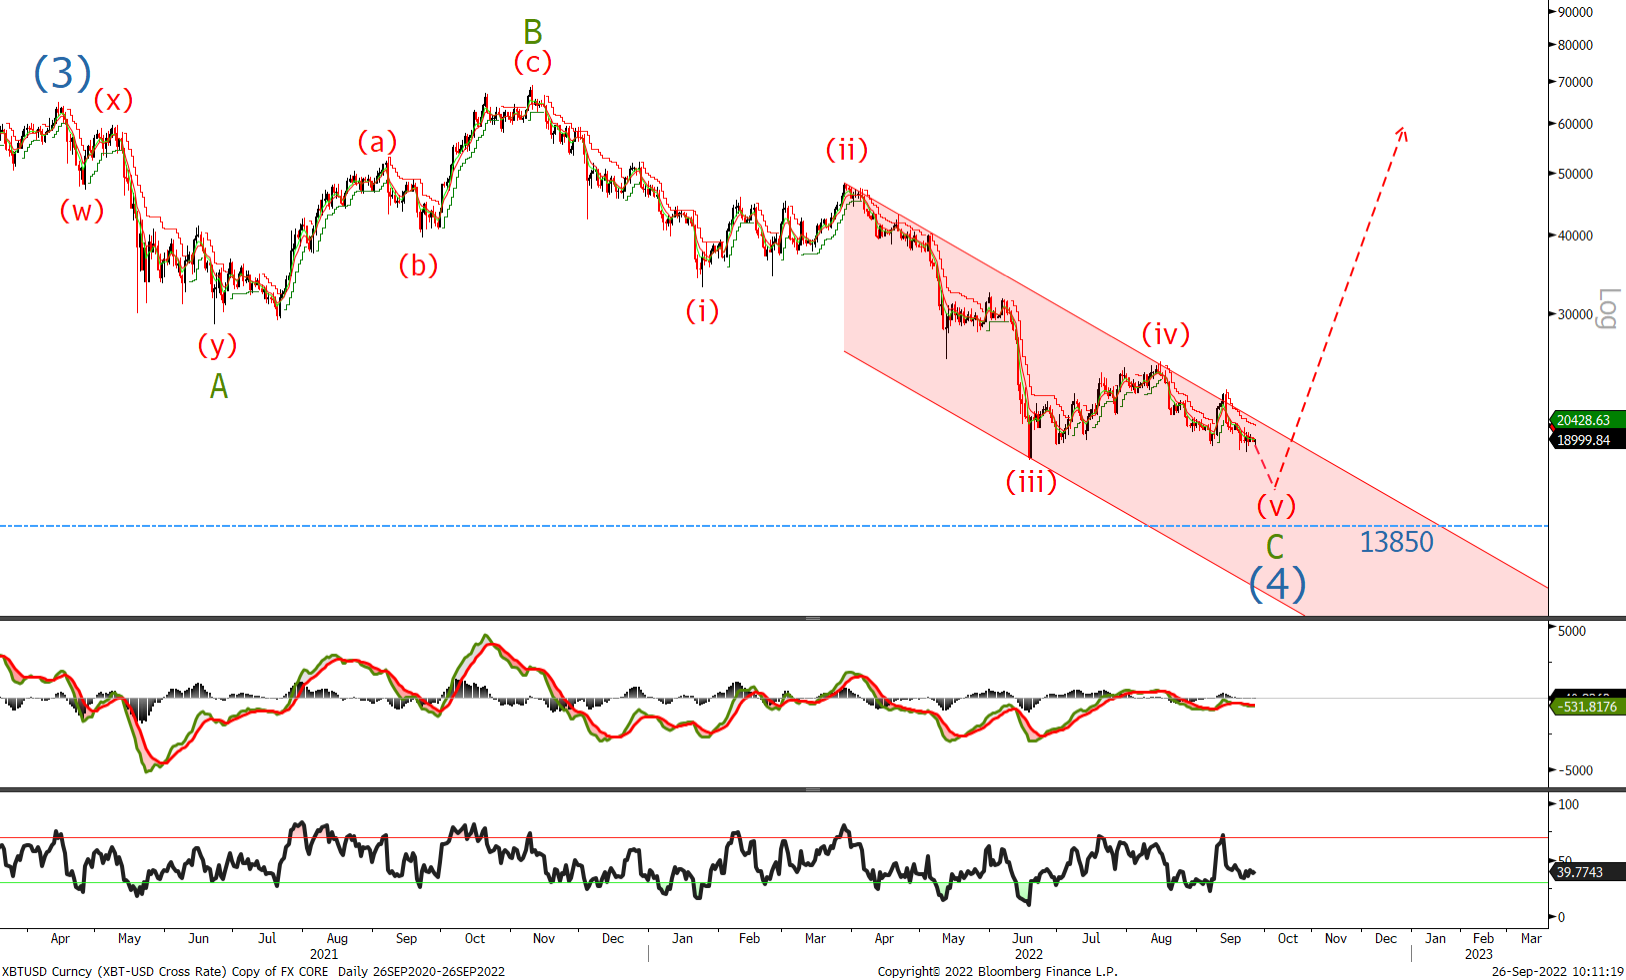
I am showing the daily log chart here and as you can see we are close to a low but have yet to complete 5 waves down. I think we will break the 17600 mentioned above and move towards the 15500 level. Buy on dips with break of the 13850 level putting a much more bearish view into play and use this level as a stop loss.
Ethereum
In the last update we said :
It looks like we have a small push higher possibly to the $1800 level before a sell off towards $1320.
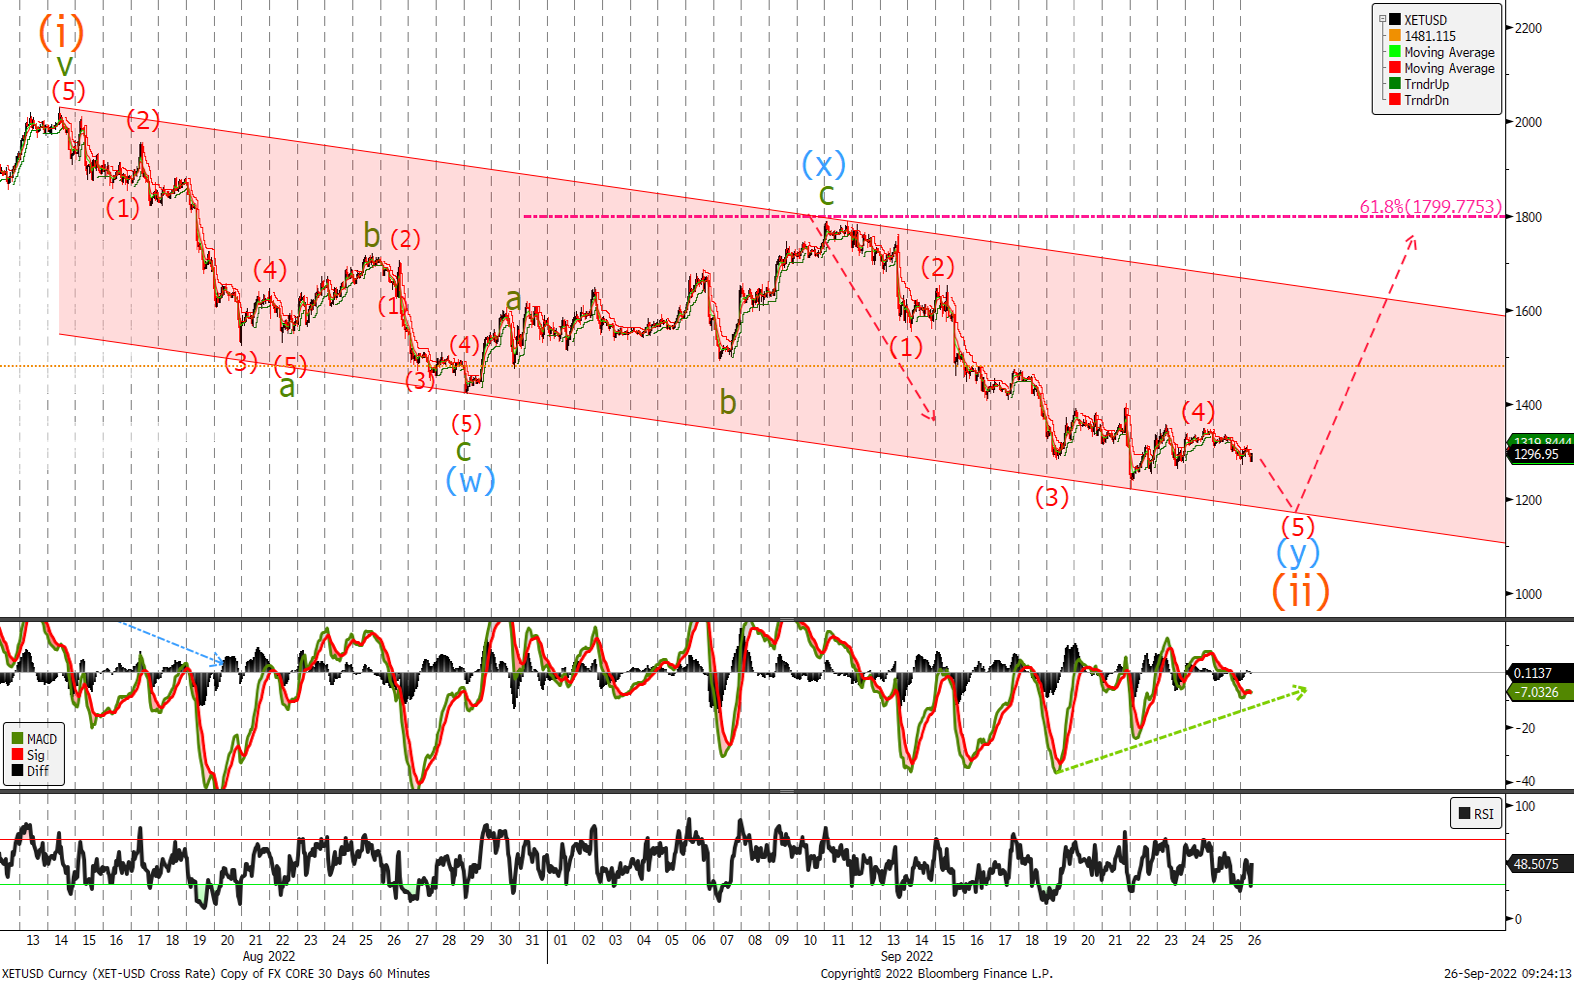
We traded to 1790 before selling off inline with expectations. Looking at the price action we can see that ETH is trading within the price channel and I expect to see one more new low below 1220 somewhere in the 1130/1180 area where we would buy , closing shorts and go long. Given the divergence in the MACD we expect a low very soon with a move back up above 1400 confirming wave (iii) higher is underway.
