Bitcoin
Last time we said :
'Buy now with stops below the 17600 line in the sand level for the bullish outlook. A break above 20200 followed by an hourly close above the red trend channel will confirm the uptrend has resumed.'
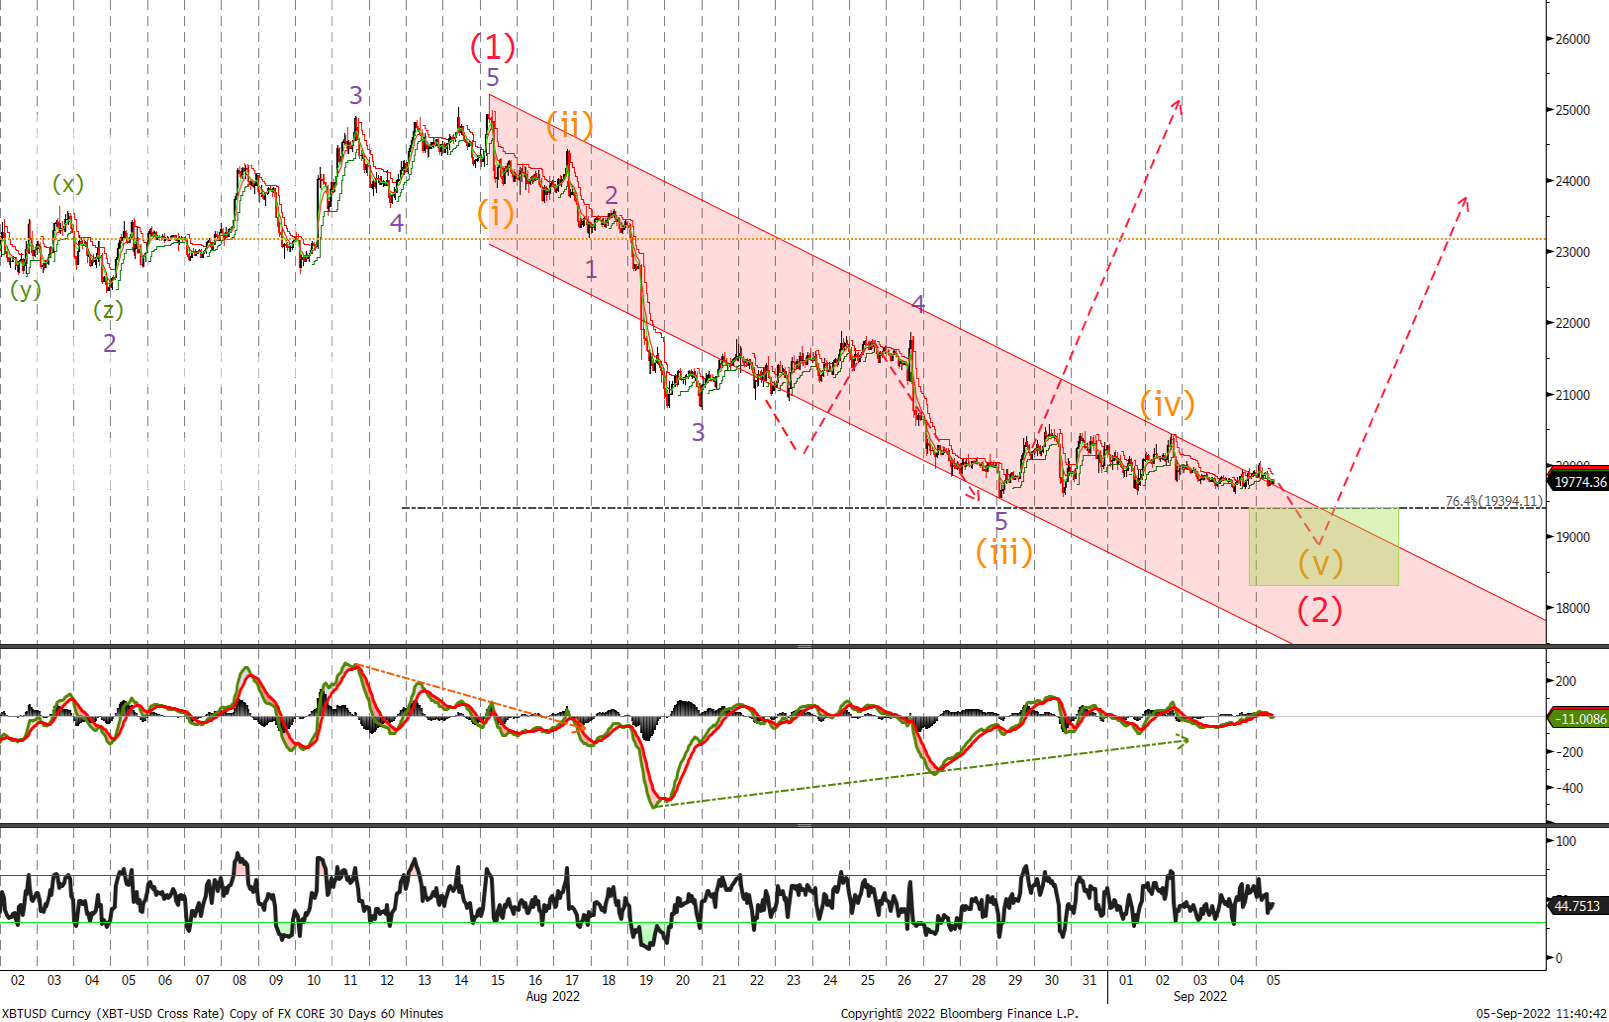
We traded to 20520 but failed to gain any real momentum. It appears that wave (2) is not yet over and we have been tracing out a corrective wave (iv) triangle with this sideways action. This implies a final push lower into the 18300/19400 where we would add to our current longs with stops remaining at last weeks levels.
Ethereum
Last week we said :
'Happy to stay long and rebuy at the 1320 and again at 1150. Place stops at 880 , to add to the position. A break above 1520 followed by a close above the channel will signal that the wave (ii) correction is complete and the uptrend has resumed’.
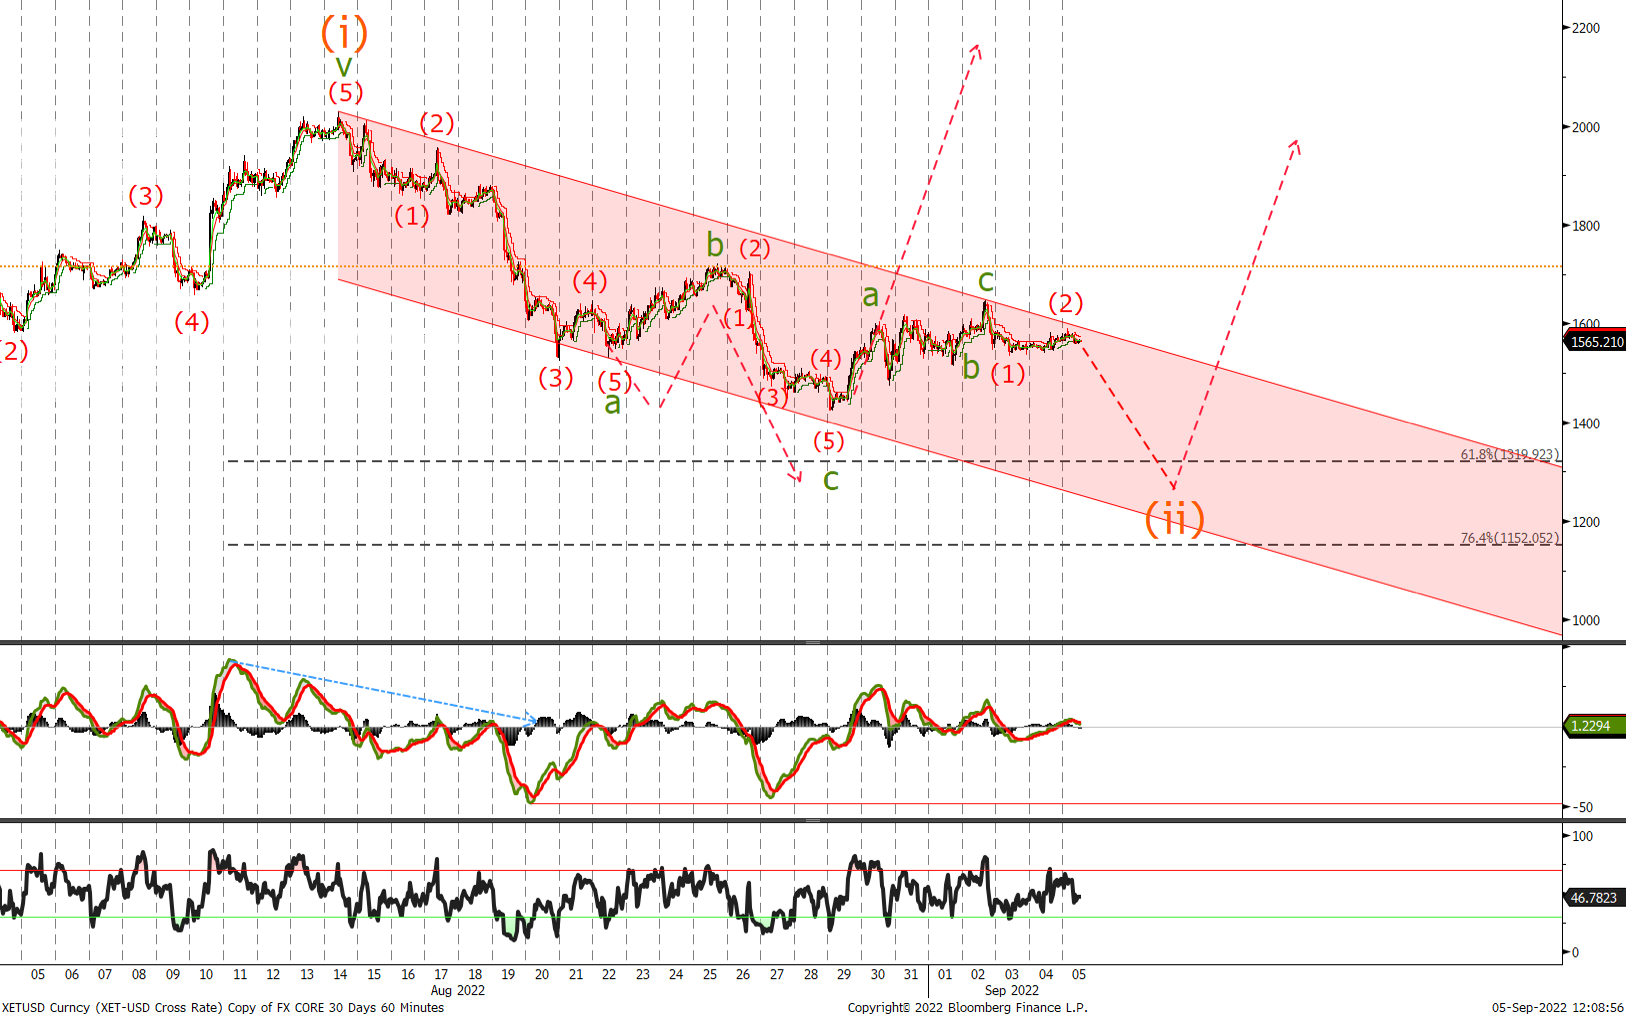
We traded to 20520 but failed to gain any real momentum. It appears that wave (2) is not yet over and we have been tracing out a corrective wave (iv) triangle with this sideways action. This implies a final push lower into the 18300/19400 where we would add to our current longs with stops remaining at last weeks levels.
