
Bitcoin
Bitcoin Long-Term Chart
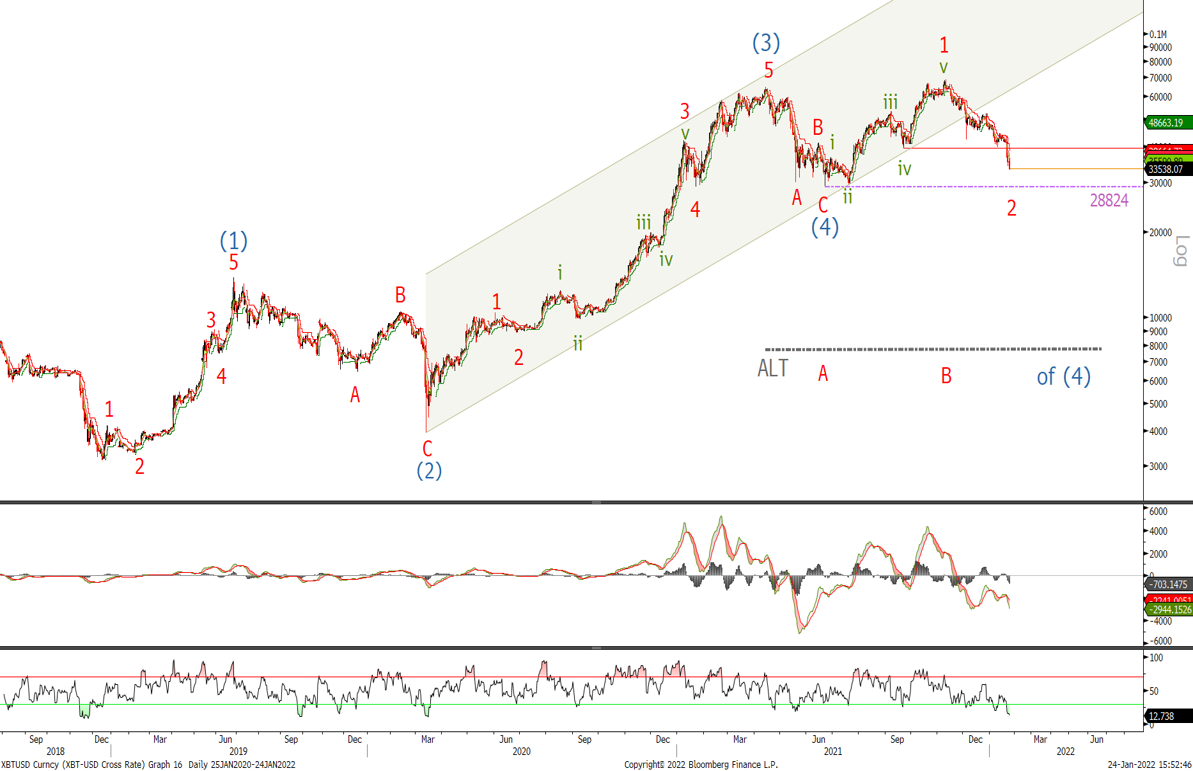
I am showing the long term chart again following the sharp sell off and whilst above $28'824 it remains valid. Last week however we did say:
‘I would like to bring your attention to the alternative scenario which calls for a larger wave (4) correction that could take the form of a triangle (often seen in a wave 4) that could see us trade in a large sideways pattern for the year or take the form of a zigzag to new lows below $29'000 to complete the larger wave (4)'
It will take a move above $69k to confirm Bitcoin's bullish trend has resumed. I will next show this alternative triangle discussed above.
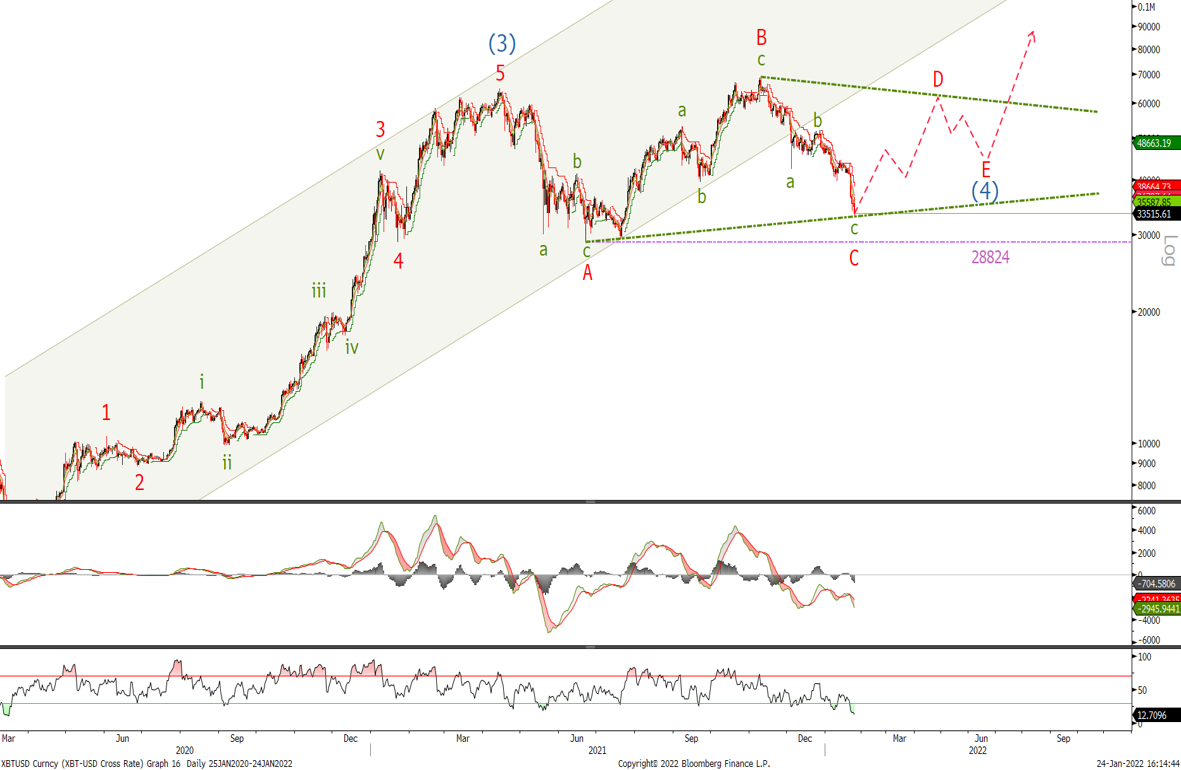
Bitcoin Long-Term Chart (Altertnative Bullish Trend)
Whilst above the wave A low $28'824 and below $68'995 wave B high, one possible outcome for the BTC is that we trade in large triangle correction for the coming months. If this or the previous view is correct then we should see a nice recovery soon and place stops below the $28'824 which would negate them both. If wave D is underway we should see a 3 wave retracement into the $55k/60k level. On a risk-reward basis we should look to buy with stops below $28'824. Let's view the short-term chart to get a clearer picture.
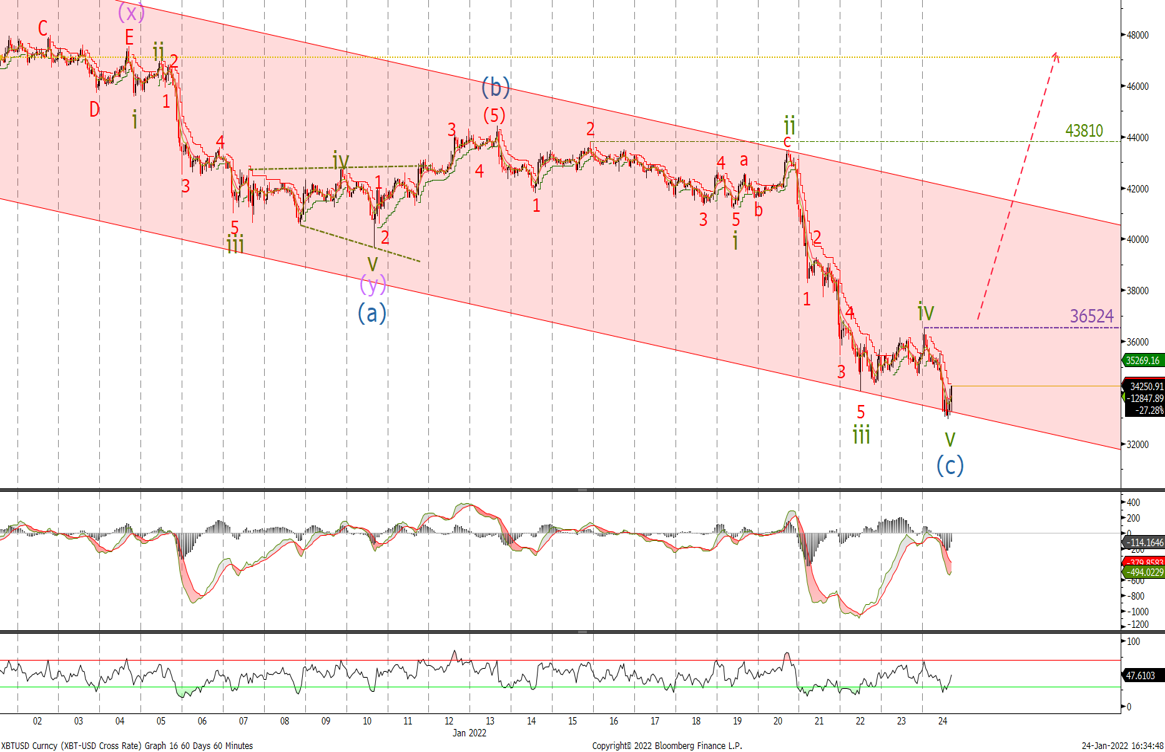
Bitcoin Short-Term Chart
Last week we said:
‘Look to buy at the 61.8% retracement level at $41'900 and again at $40'800 with stops at $39'633'
Given we have traded down to $32'970, it was not such a large loss 1717 pips. If wave v is in place then we should stay above $28'824. Rather than catch a falling knife, I would rather wait for a move above $36'524 to confirm a low is in place and use the recent low as a stop level.
Ether
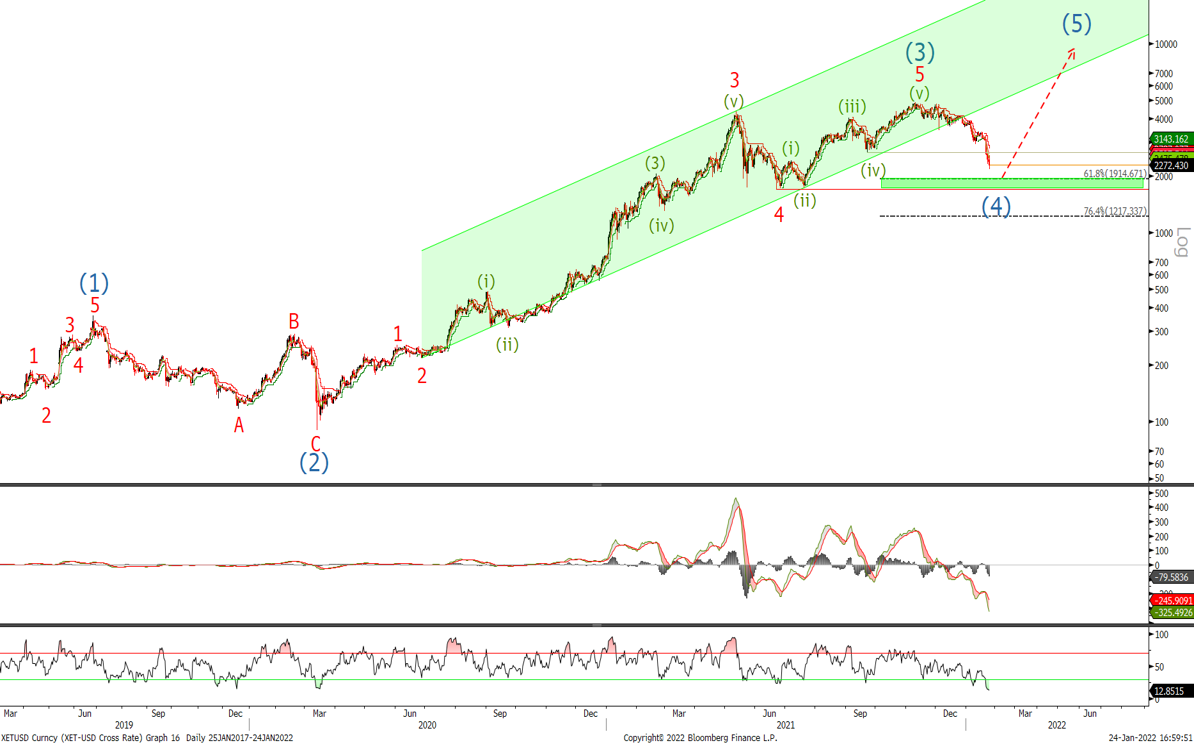
Ether Long-Term Bullish Chart
Last time we said:
‘A break below $2'600 could indicate a test of the $1'700 level’
The long term logarithmic chart of Ethereum is approaching a good support zone comprising of the 61.8% retracement level at $1'914 and the area of the previous wave 4 at $1'700.
Lets look at the short term chart to see if we are close to completing the wave (4) correction.
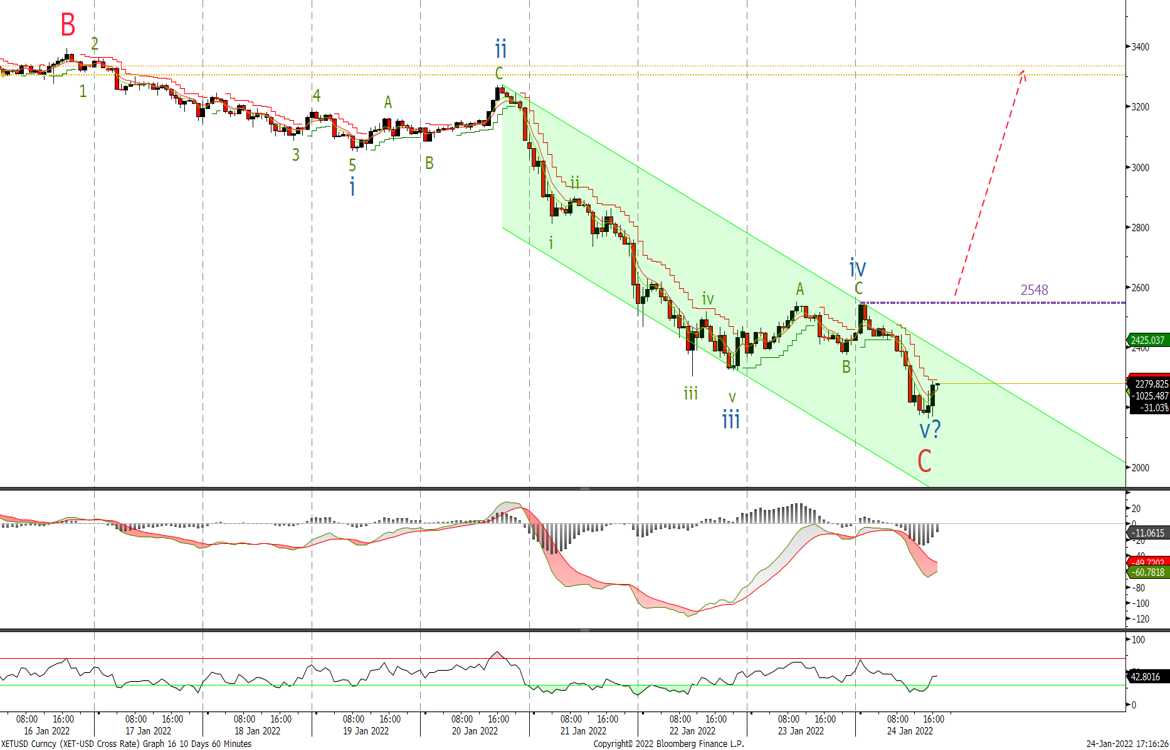
Ether Short-Term Bullish Chart
Last time we said:
‘A break of 2900 will negate then view but I will remain bullish until we break the longer term support level at 2600’
On the previous chart we adjusted the count to show wave (3) has completed and we are correcting lower. Looking at the hourly chart we can see a divergence forming in the MACD and wave i and v are currently of similar length.
Given it is hard to pick a bottom in such a sharp sell-off, I would wait to buy ETH on a move and hourly close above $'2548 with stops below the last low.
Written by Matthew Clark
