
Bitcoin has reached a new all-time high today, reaching $66.9k. Digital gold has performed extremely strongly in the last few weeks, soaring by more than 30% during the month of October. We'll delve into how long-term holders are behaving, as tendencies transition once prices reach new all-time highs. We had established in previous reports that long-term holders (LTHs) had undegone a period of bitcoin accumulation since the July lows of $29k. It is therefore important to see whether LTHs are starting to spend or if they are continuing their holding behaviour.
We'll look into:
- LTHs spending behaviour and patterns
- Amount of profit and losses realized in the market
- Overview of derivatives market
Long-term holder Net Position Change
A coin is considered long-term if it is held for more than 155 days. If a long-term coin is spent, it is again considered to be a short-term coin. The metric below expresses the net amount of coins that transition between short-term and long-term. It is a good metric to use if we want to gauge whether investors are looking to hold or sell.
The metric was red during the 2021 bull run, meaning that more coins transitioned into short-term coins than long-term. Investors were selling or distributing their coins into market strength to realize profits.
The metric spiked up into the green since the sell-off and July lows as more coins transitioned into long-term than short-term. Investors accumulated cheap coins for the long term.
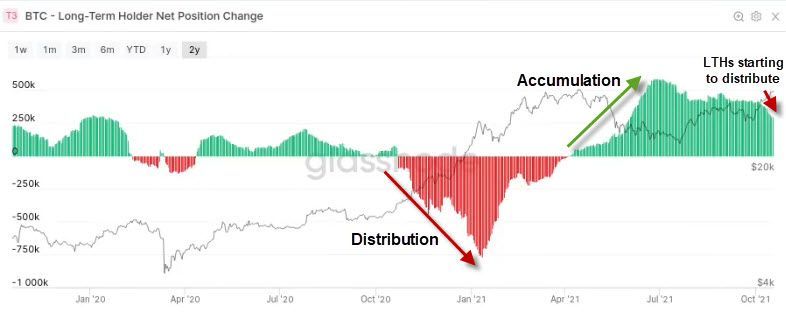
The metric has signficantly decreased in recent weeks suggesting that LTHs have started to distribute or sell their coins. Although the metric is still in the green, LTHs are starting to spend their coins which is less constructive for price.
Realized Profit
The realized profits metric expresses the amount of profits realized at a certain price level. This metric sheds light on the relationship between demand and supply when compared with price. If both metrics trend similarily, supply outstrips demand which usually causes a correction in price. Conversely, if realized profits are well below price levels, the demand is able to absorb supply and sustain upward price movement.
A large amount of profits were realized in the first half of 2021. The metric peaked around the same time as prices in April. This suggests that demand eventually plateaued and was no longer able to absorb the increased selling pressure. Prices and realized profits subsequently fell and bottomed in July.
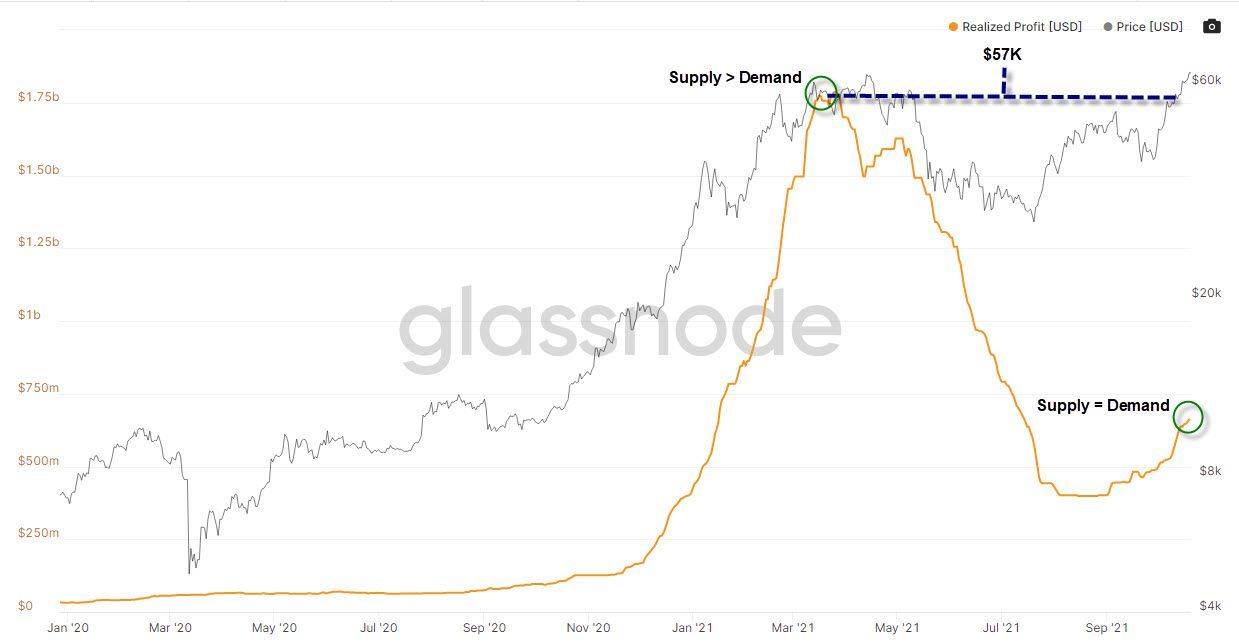
Currently, realized profits have only slightly picked up, despite prices nearing the same levels it had reached in early 2021. The last time we reached these price levels, realised profits were at $1.75bn whereas currently they are only at $660 million. This means that demand is currently strong enough to absorb the increased sell-side pressure at these price levels. This is extremely positive as the coins that are sold to realize profits are being met with enough demand to sustain the upward price movement.
Exchange Net Position Change
This metric measures the ratio of coins that flow into and out of exchanges. When the metric is red, more coins are moved off exchanges suggesting accumulation by investors. Conversely, if the metric is green, more coins are moved onto exchanges suggesting investors' intention to sell.
There were large net in-flows during the May-July period as investors looked to sell their coins. We observed significant net outflows since then.
In recent weeks, the net exchange position change has softened and decreased by 92%, as investors have started to sell. The metric has now returned to a neutral state as inflows now match outflows. This is not extremely bullish or constructive for price, however the increased selling pressure is being absorbed by demand which is positive.
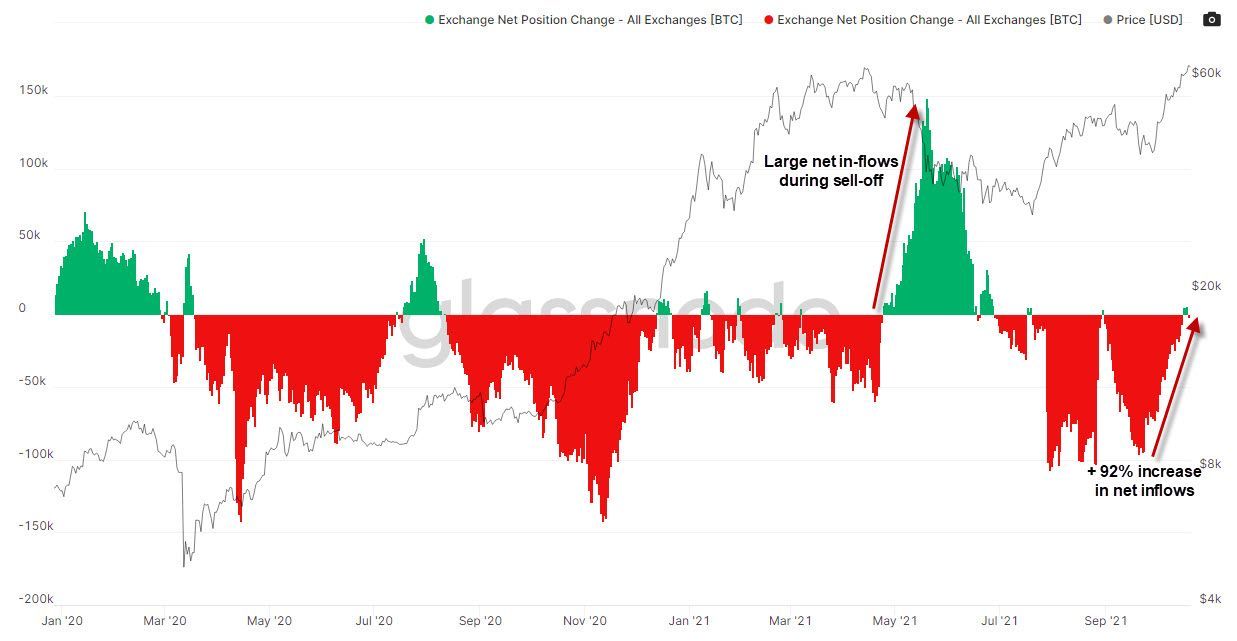
This is positive as we are at in an equilibrium state despite being so close to a new all-time high. Market demand is still relatively quiet as there are low transaction volumes and value, as well as no extreme media influxes. This explains why we were able to make new all-time highs.
Derivatives Market
An increase in activity in the derivatives market can lead to short-term volatility and is therefore important to monitor. Given the positive price action currently observed, it would be interesting to see how leverage long the market is. If too many long positions are opened, there could be a risk of a cascading long-liquidation if the market pushes significantly in the other direction. This would cause a major downside pullback in price.
Options Open Interest
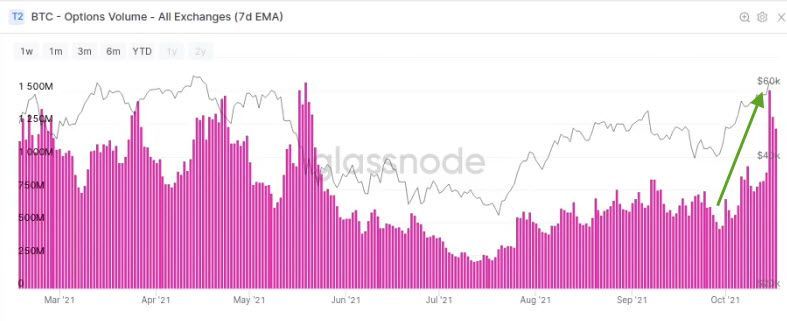
There was a large increase in 'Options Open Interest' since the September low, as many investors are buying 100k to 150k call options that are due to expire for the end of year. This is due to the strong sentiment for a strong end year.
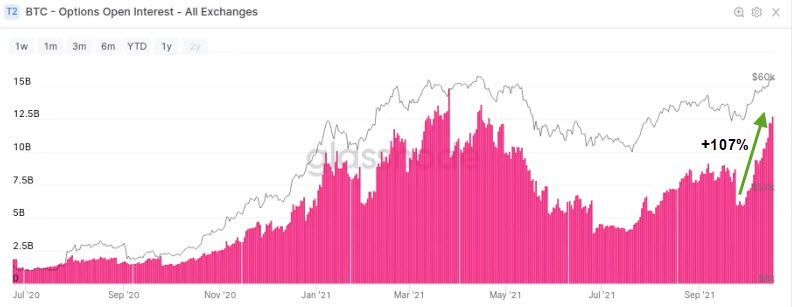
The volume of options has also significantly increased during October and now has almost reached a new all-time high. This is positive as investors have strong sentiment for updward price movement in coming weeks. It however also increases the risk of a potential long liquidation if prices were to suddenly drop. Having said that, this increased risk isn't very significant when we take the overall derivative market volume into account (more below).
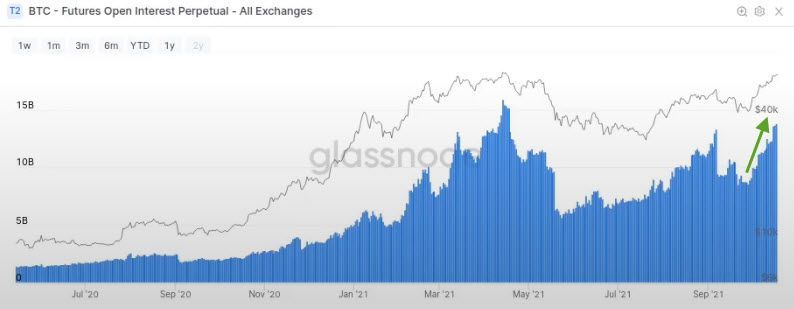
Futures Open Interest Perpetual
'Futures Open Interest' has also increased signficantly since the September low. This again consolidates the positive sentiment in the market but requires investor to consider the growing risk of a long liquidation.
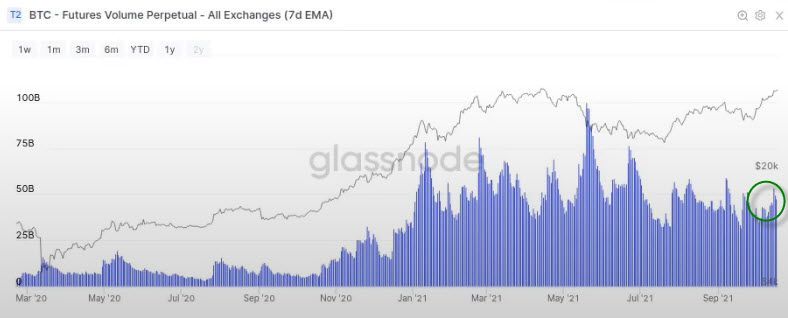
Futures Volume Perpetual
The overall volume in the futures market hasn't experienced the same increase in volume as in the options market, as can be seen on the graph below. Furthermore, future's volumes dwarf the volume in option's markets as the former stands at $50 billion whereas the latter has a $1.3 billion.
The increase in options volume is therefore not significant with regards to the overall derivatives market. As such, the risk of a long-liquidaiton is still relatively low.
Concluding thoughts
We established that there has been an increase in spending from LTHs, as they are slowly starting to sell their coins into market strength, and realize profits. Exchange outflows have decreased which isn't very constructive for prices. However, the metric is in equilibirum which is a positive sign given that prices have almost reached new all-time highs. There is an increase in leverage in the derivatives market as both options and futures markets have seen an increase in volume, notably the opening of long positons. These increases aren't large enough to pose a significant threat of a long-liquidation. All of these factors point to the market feeling bullish about prices skying high in Q4 of 2021.
