Bitcoin Weekly Chart
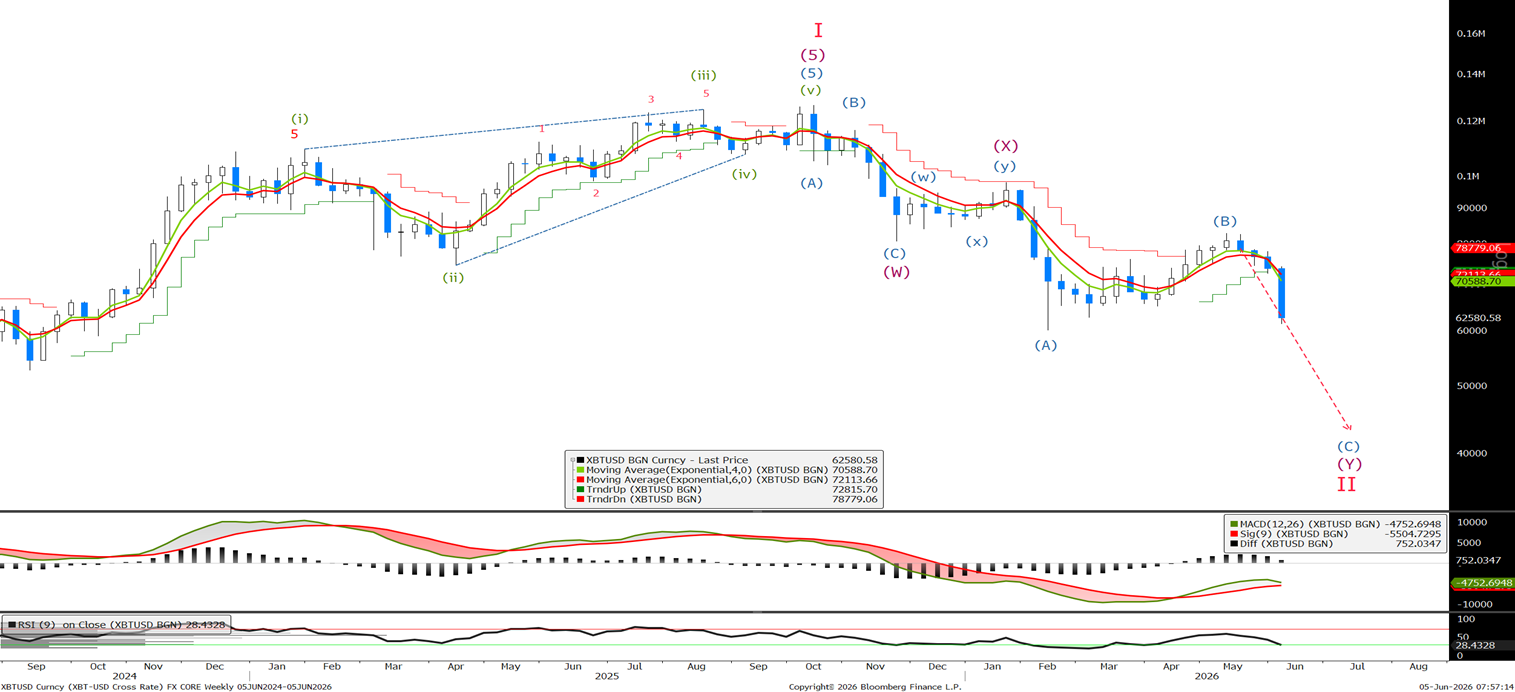
We are starting to gain momentum to the downside and no change to the view, ‘We remain bearish on the BTC and I have left the arrow unchanged on a weekly basis. Let's look at the short-term charts as we continue to look for BTC to trade below 60k.’
Bitcoin Daily Chart
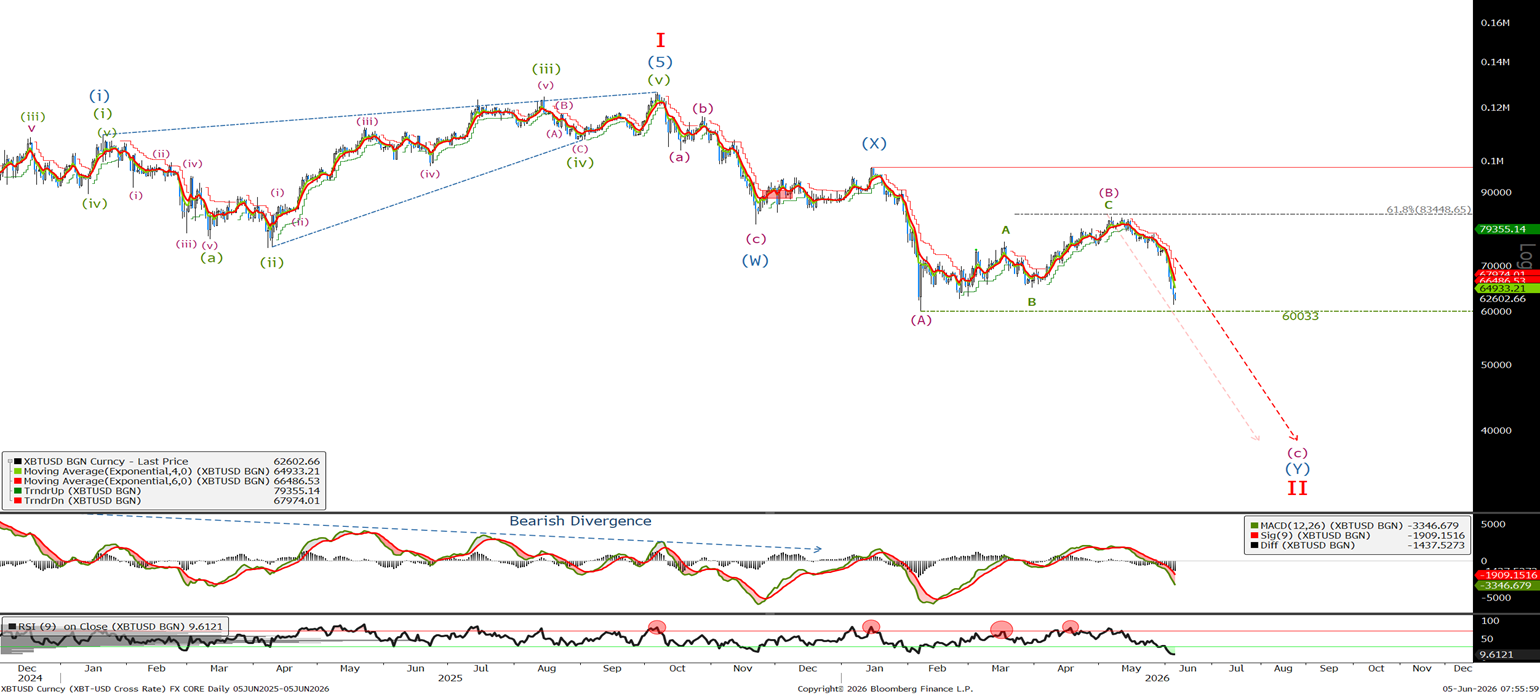
On Monday we said 'on a daily basis, whilst below the 83.5K level, I will remain bearish. We have dropped around 6.5% since last week's update and I would use any retracements to sell into with stops above the wave (B) high.' As you can see, we have continued to sell off, and we are approaching the minimum target for wave (c) below 60033. Let's look to the short term to see how close we are to the end of this current sell off.
Bitcoin Short Term Chart
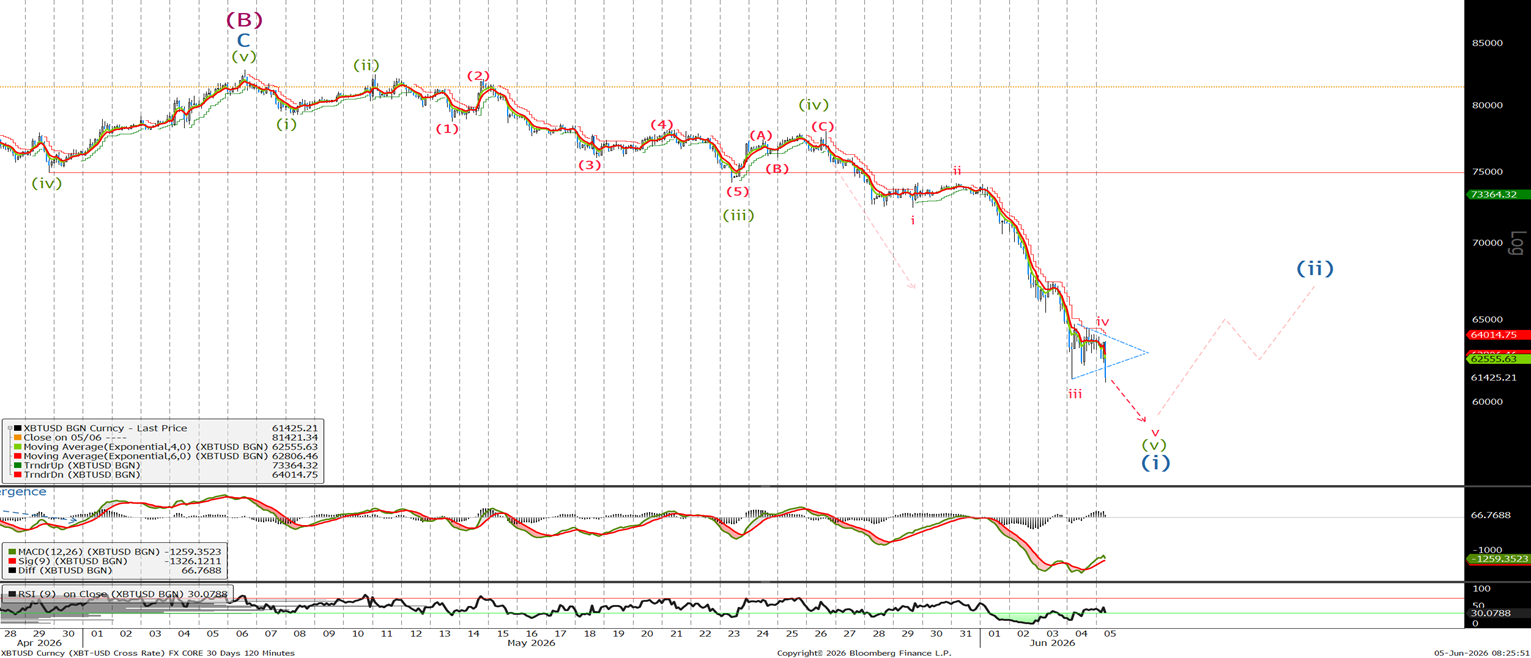
Last time I said, ‘it appears we have one slight new low towards the bottom of the channel at 71.6K. I am reducing my short position and will look to add to the remaining shorts at 74.3K and add it to 75.9K with stops now lowered to last week's highs at 77.9K’ I was expecting the channel to hold, but we blew through it, so I am glad I kept my remaining shorts. As I type this, it appears we are in final wave v of wave (i). This will probably be towards the 60k level. Once complete, we will see a 3 wave correction which will provide an opportunity to resell. There is a saying in trading to never try and catch a falling knife, so I will let this final wave play out before looking for sale levels. There could be a lot of stop losses below 60k, so it will be interesting to see how the next few days play out.
Ethereum Long Term Chart
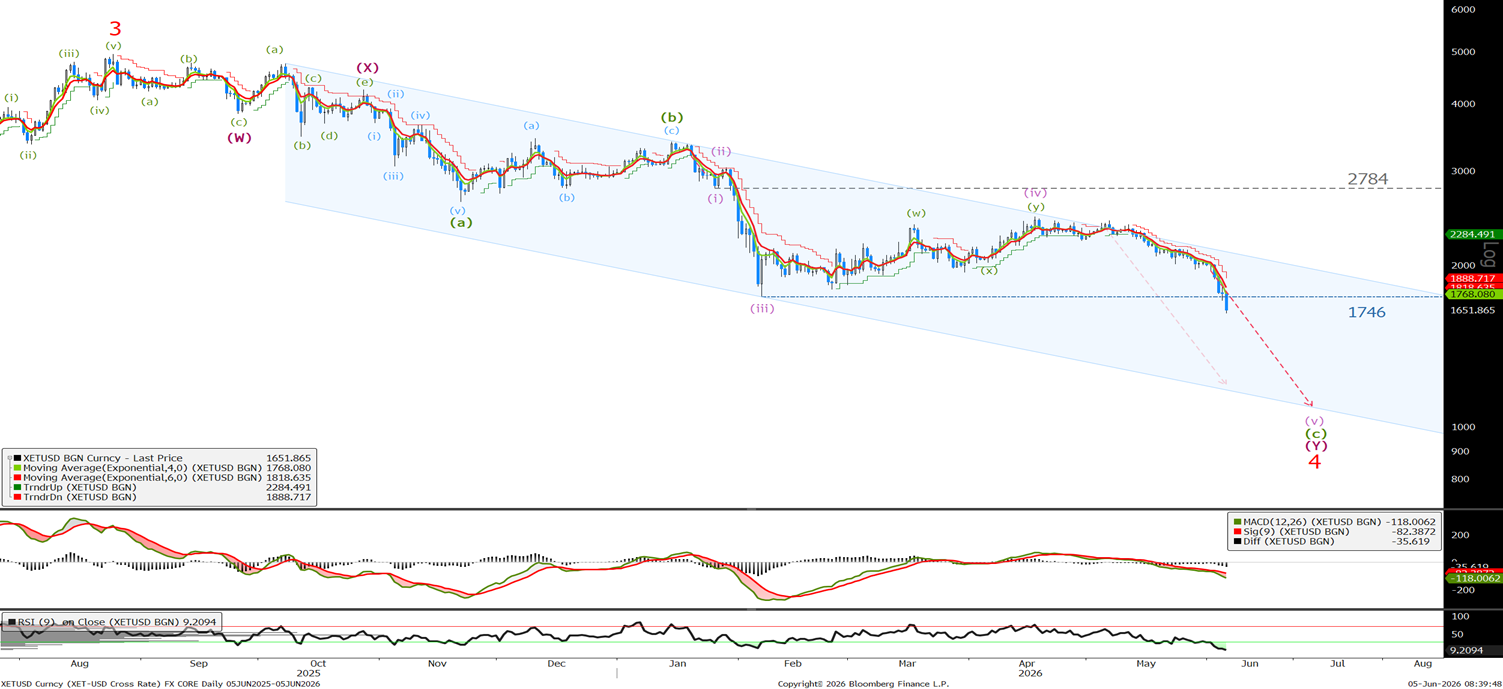
Last time we said, ‘As you can see, there is no change in the view as we continue to trade lower. We need to trade below 1746 to complete 5 waves. In the shorter term, we could lower the stops to 2500, and I would start reducing my position below 1746.’ This morning we broke that level, so let's look to the short term to see if this leg lower is close to ending.
Ethereum Short Term Chart
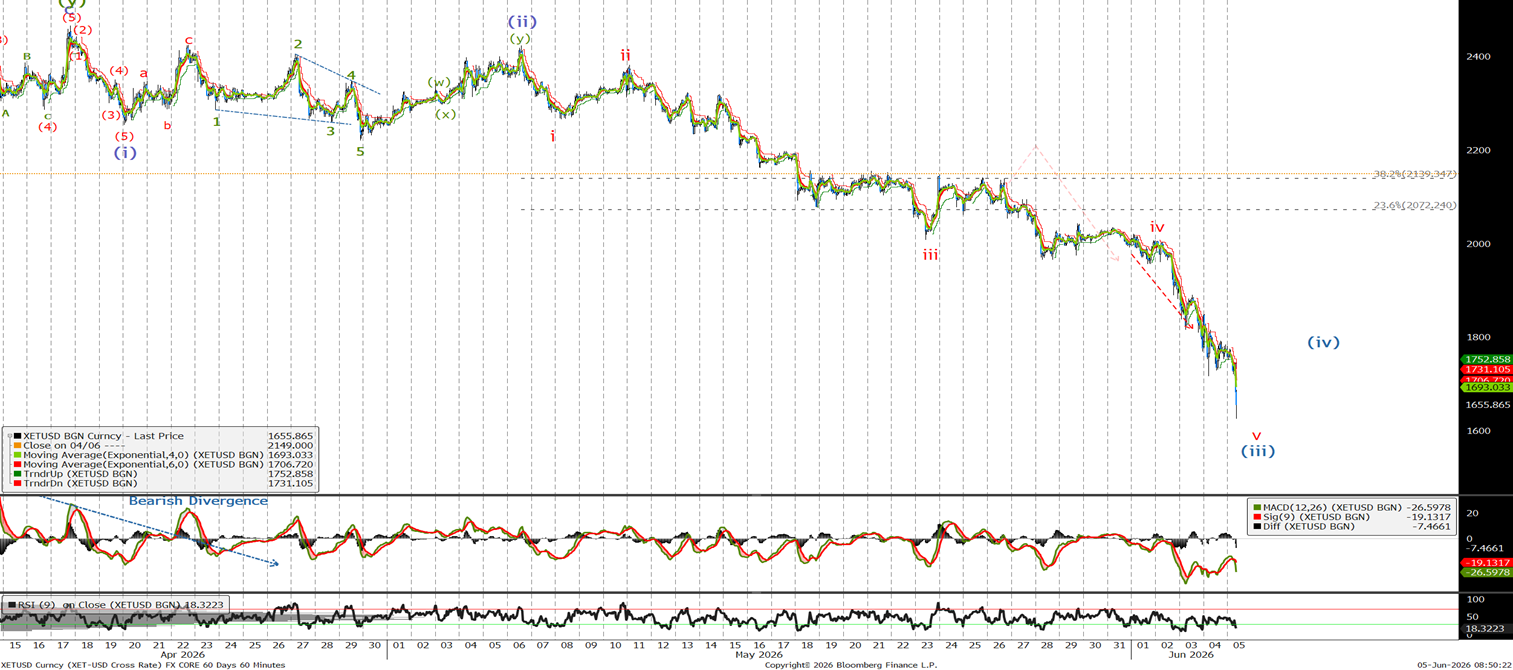
Last time we said ‘we need to make a new low below 1964 to complete 5 waves, look to reduce shorts below there. Once in place, we will have a better idea of possible levels to resell, but until then, we remain bearish in the short term.' The 1964 break saw an acceleration lower and looking at the wave count once this current sell off complete wave (iii) we should see a correction enabling us to sell possibly back towards the 2000 level. I am therefore reducing my position and will add to shorts on this correction. However, I believe there is still further to go to the downside in the coming months.
