Bitcoin Long Term Chart
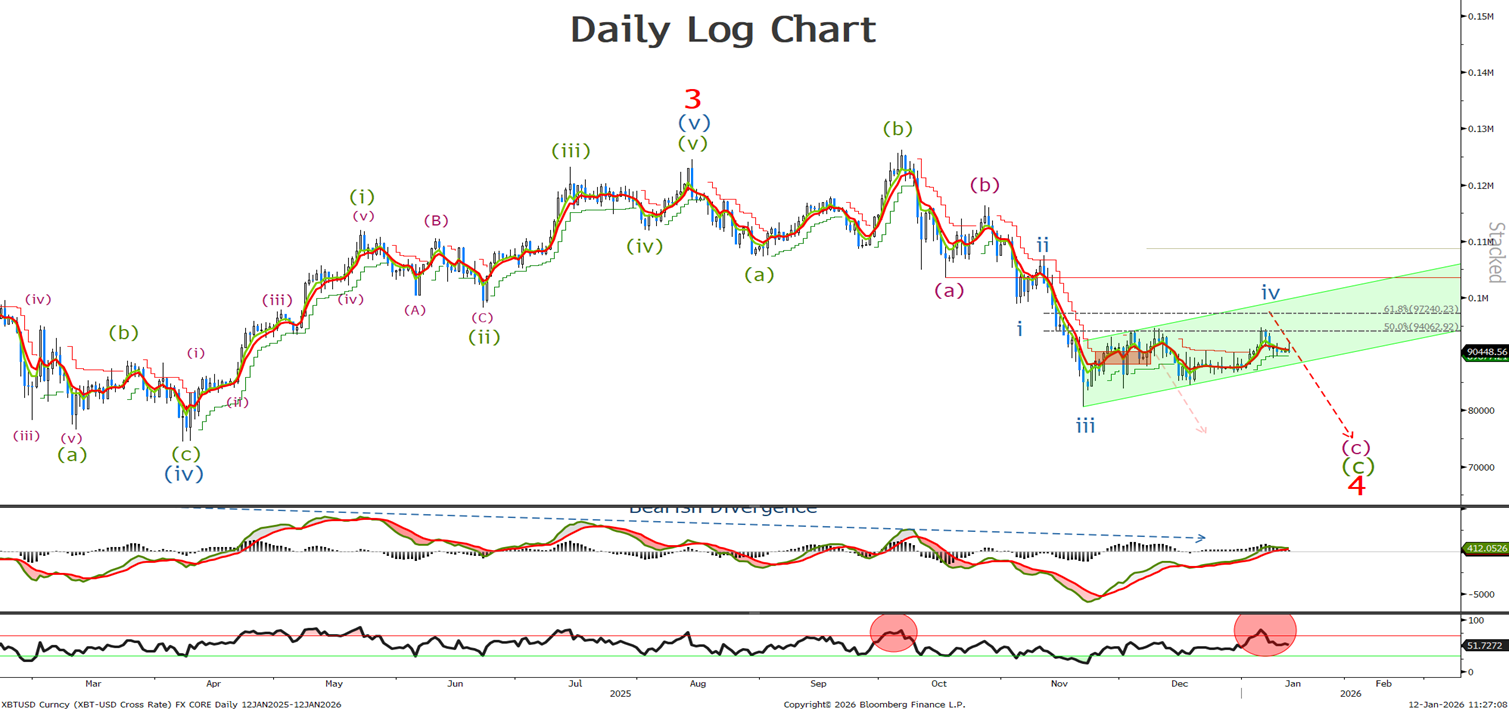
Last time we said ‘Look to sell at the 97K level and I would move my stops up to the wave (a) low at 103.7K. I will remain bearish on the BTC for a push towards the 80K level.’ The BTC has drifted off since the last update but no change in my underlying view, at this time, expect an acceleration on a break out of the channel.
Bitcoin Short Term Chart
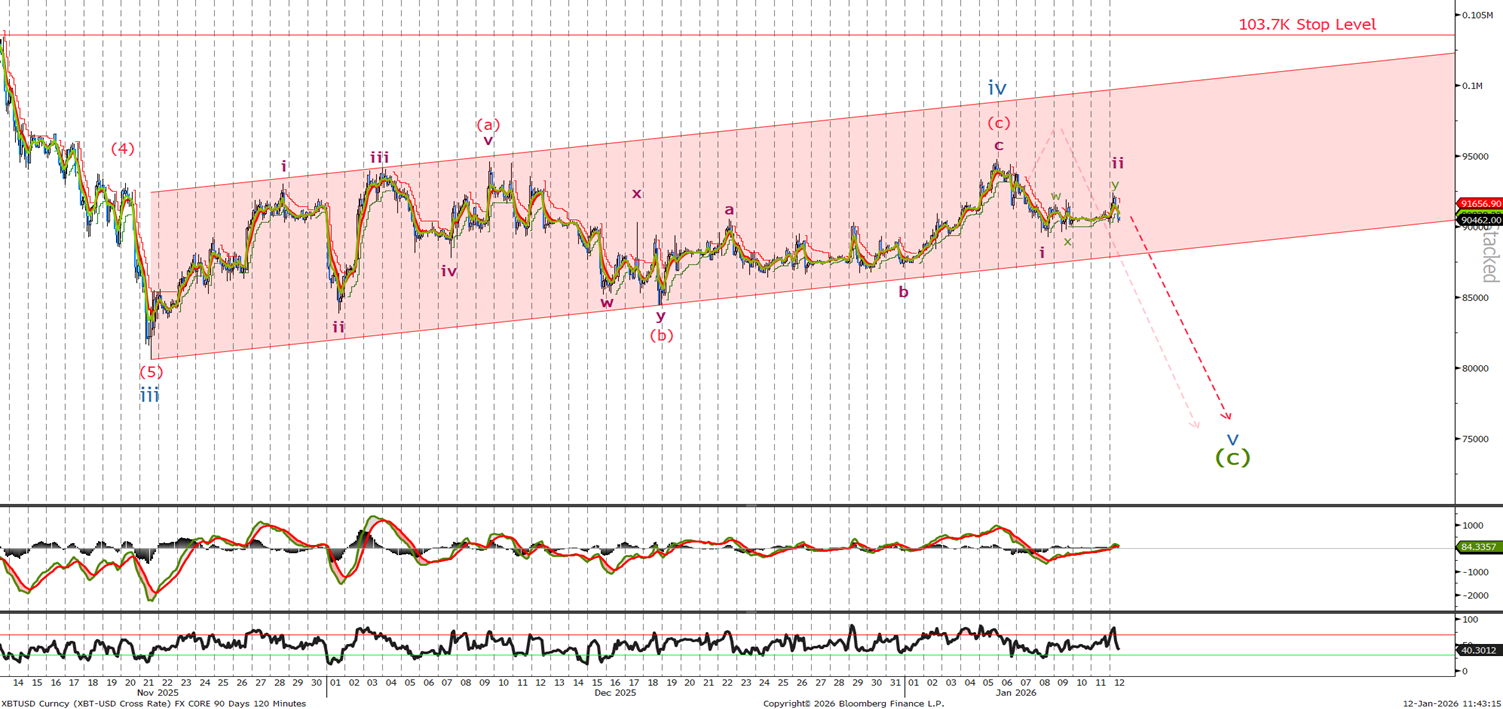
Last time we thought wave iv was on going and ‘ We remain bearish whilst below 103.7K stop level. I think we see a short term push towards the top of the channel before the sell off to at least below 80k.’ We instantly traded lower and I have relabeled the short-term chart with wave iv completing at 94785 before selling off. It appears that minor wave ii is complete so sell now at 90460 with stops above the high of wave iv or at the previously mention 103.7K.