Bitcoin Long Term Chart
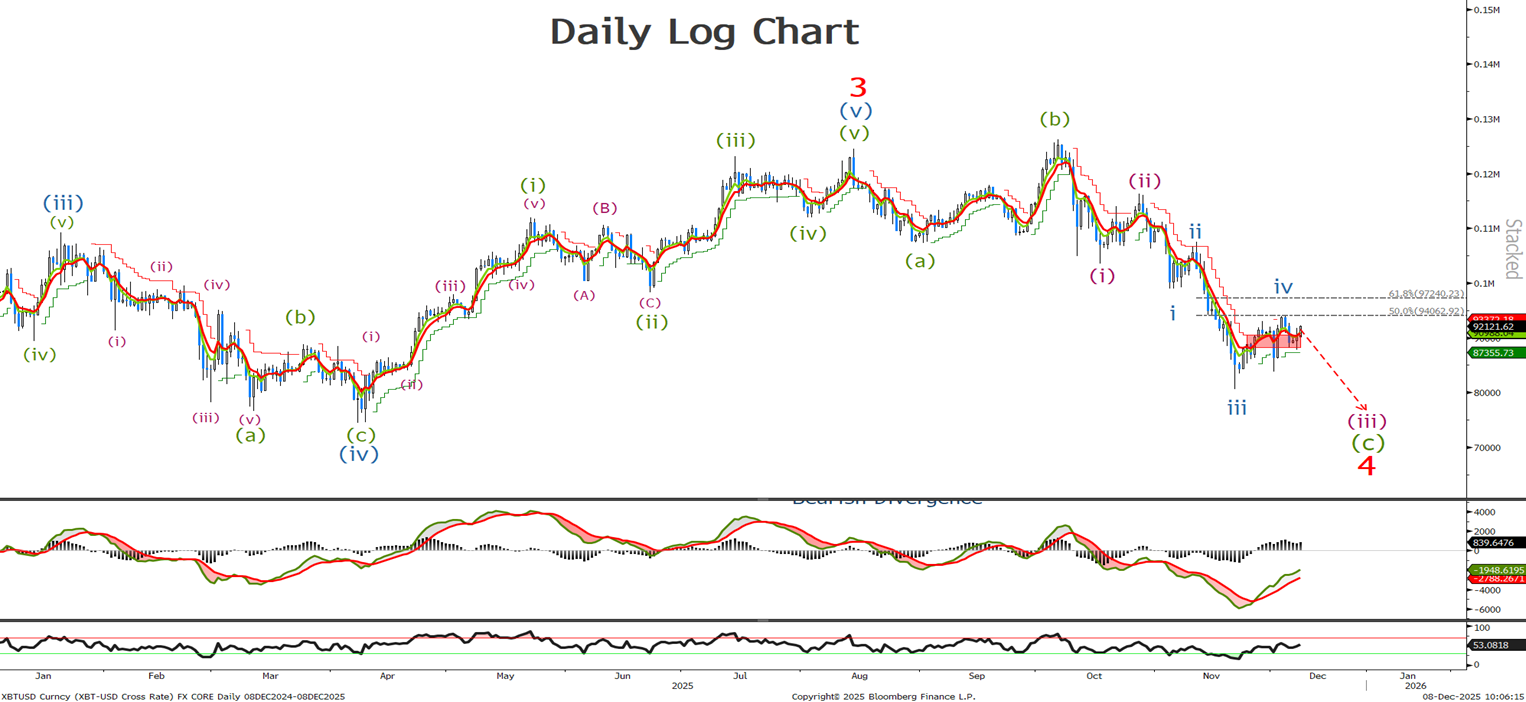
Last time we said ‘this mornings sharp sell off looks to confirm that wave v of (iii) for a new low below 80550 is underway ,’ We traded slightly higher and tested the 50% at 94063 and whilst below 99k we will look for BTC to trade lower below the 80k level. Add to shorts at 97.2K with stops at 99k or 107k for a longer term trade.
Bitcoin Short Term Chart
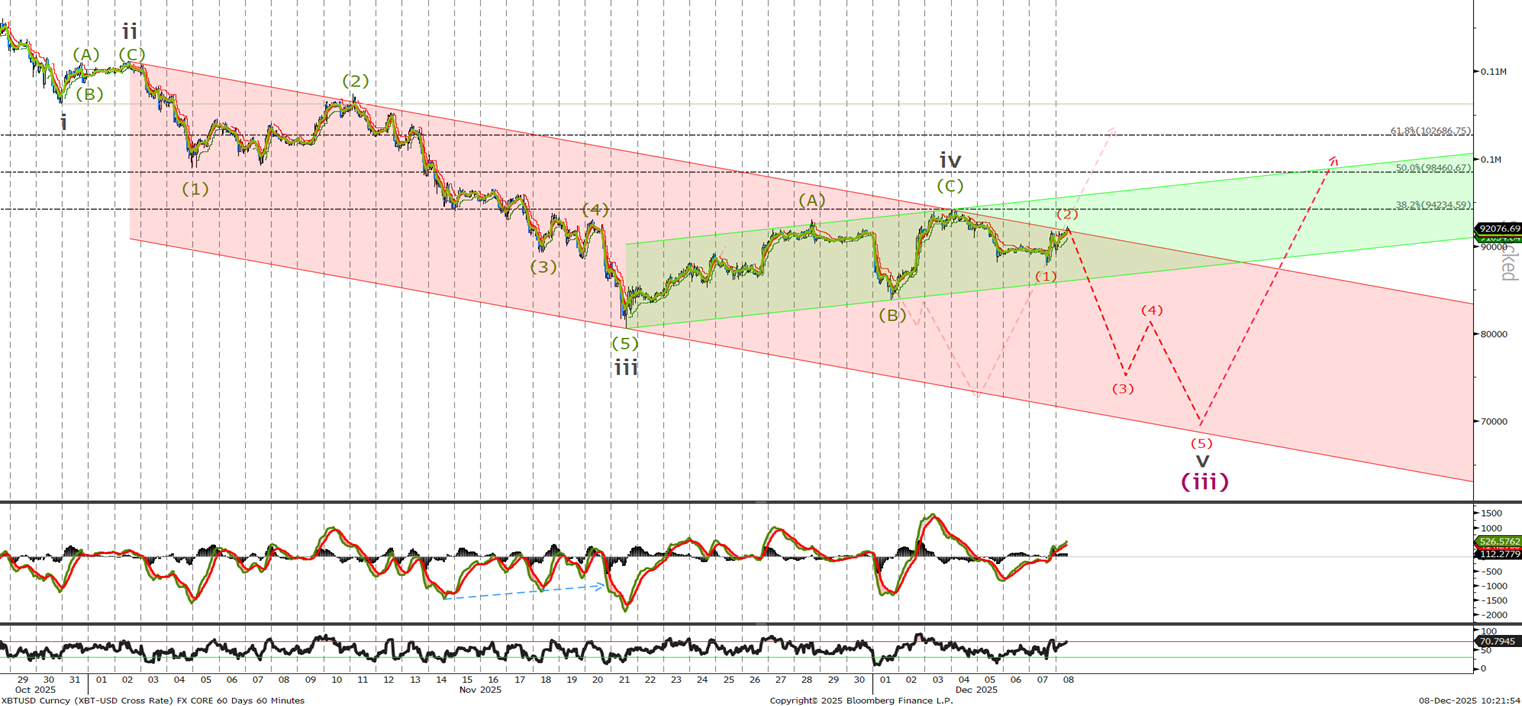
Last time we thought wave iv had finished but it failed to hit our ‘stops at 99k and look for a push down towards the 70k initial level.’ We traded slightly higher testing the 94.23K level and the 38.2% retracement level in the short-term. As I type this we are testing the top of the channel and I will remain bearish whilst below the 99k level , looking for an acceleration on a break below the 84k level. Towards the bottom of the channel with targets towards the 64k level.
Ethereum Long Term Chart
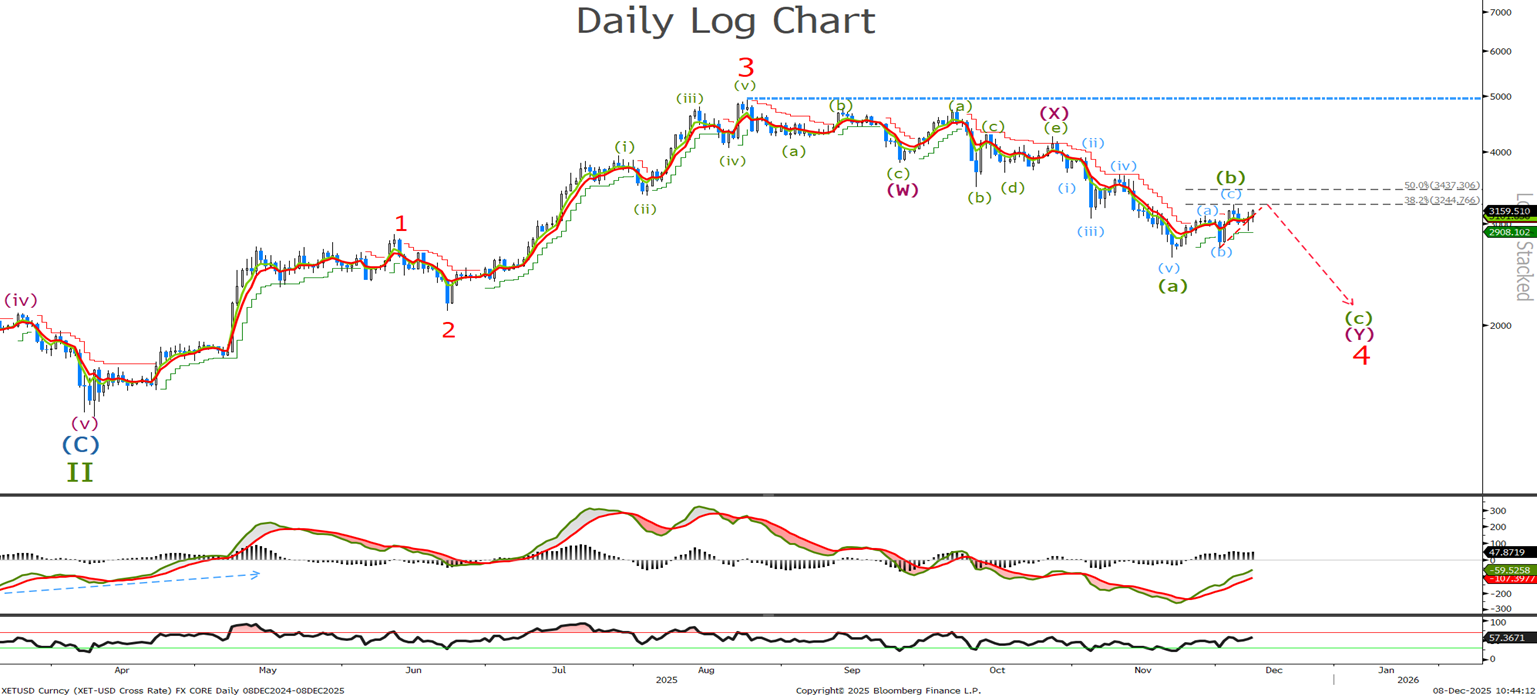
Last time I was looking ‘for a correction up towards the 3244-3437 level to complete the third wave of the wave (b) correction before another sell off in 5 waves lower to complete wave 4. Look to sell up there with stops on a longer term basis above 4200.’ We traded to 3240, inline with expectations and should see a sell off anytime soon. Sell again at 3430 and lower stops to the wave (w) low at 3827. Lets check the short term to see if signs that wave (b) has ended.
Ethereum Short Term Chart
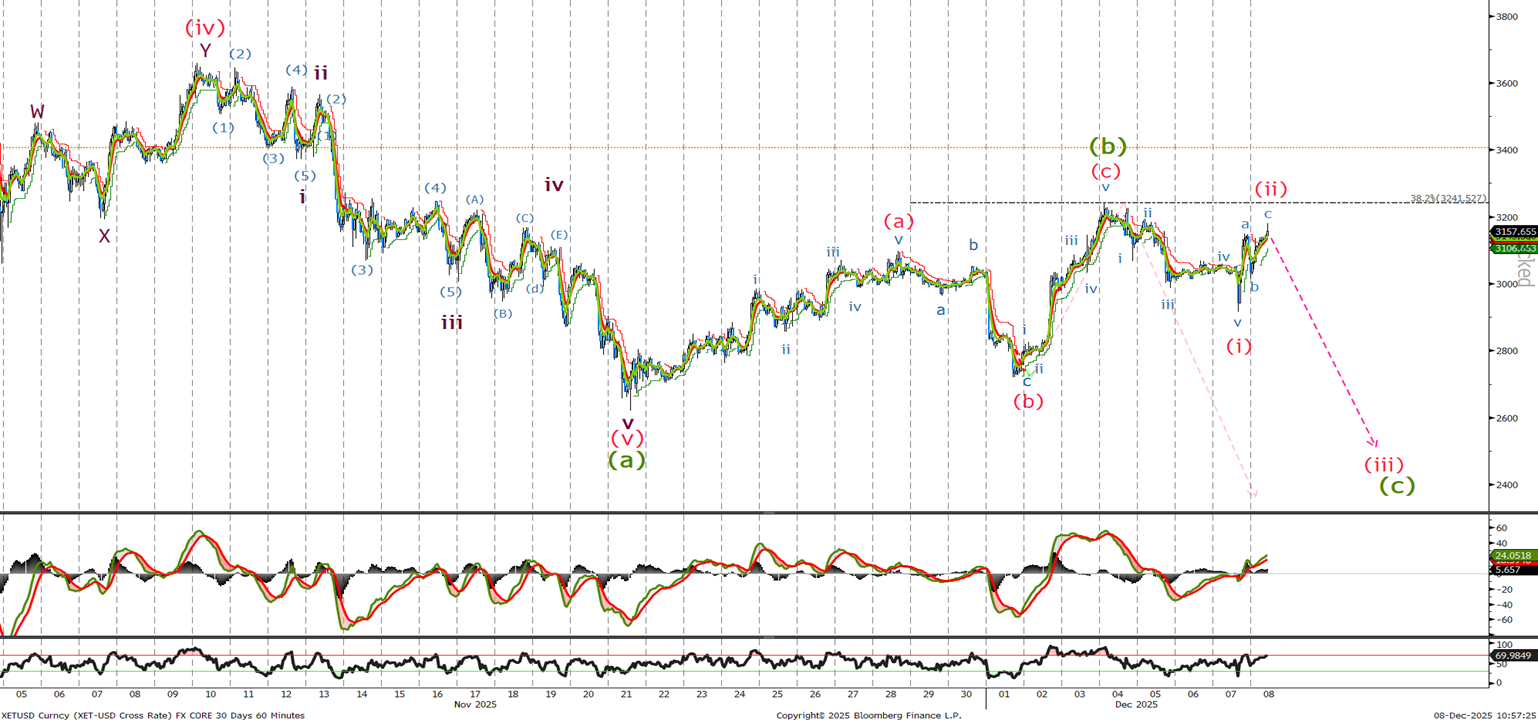
Last time I said ‘we are currently testing the 61.8% retracement level and I am expecting ETH to hold around here or slightly lower at 2733. Look to buy there with stops below 2620, Looking for a push up to 3240 and possibly 3420 where we will sell ETH with a target to the down side in 5 waves for wave (C) around the 2230 level. Stops are far away at 4260 on the topside.’ The low was 2719 enabling us to buy before trading up to the 3240 level mentioned , the minimum retracement. We have sold there, and if not short sell now at 3160 with stops above 3700 for a push below 2500.