Long Term Chart
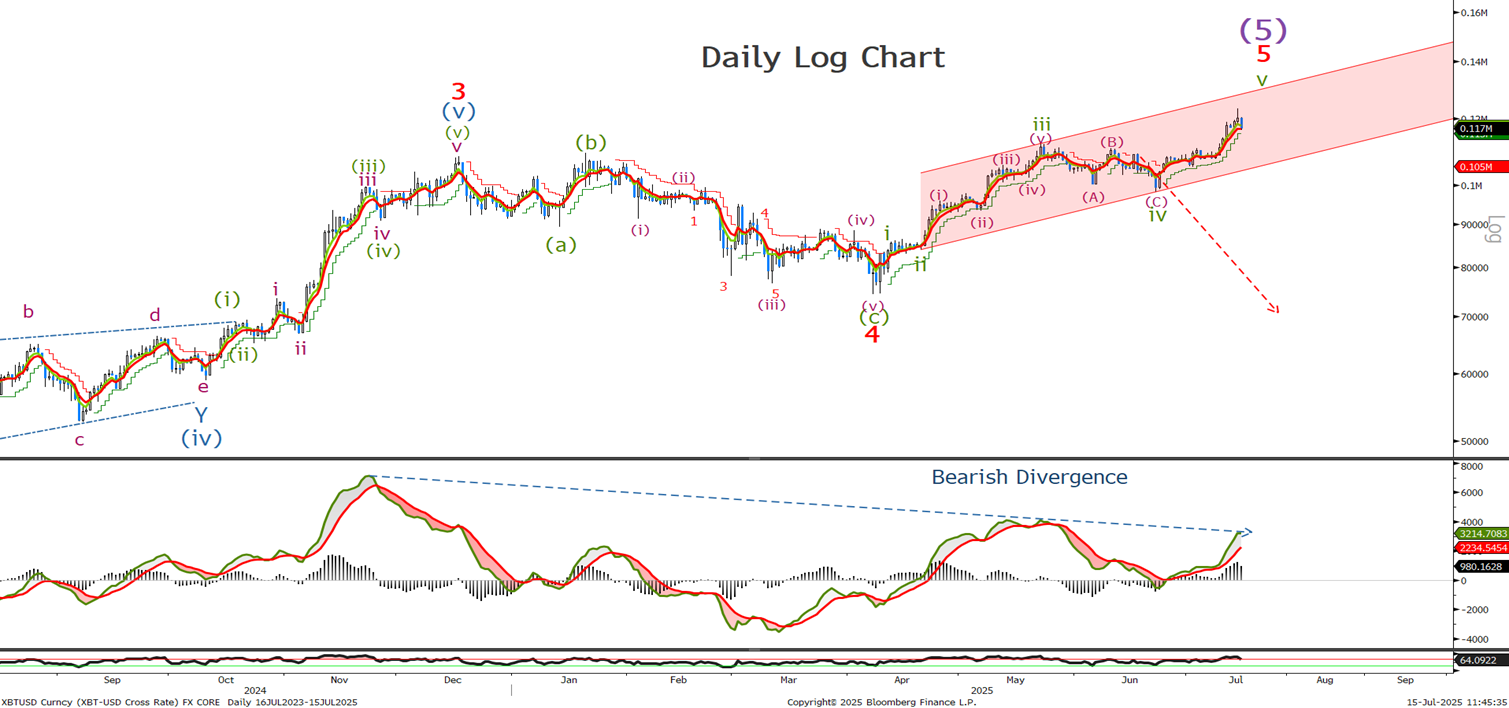
So we finally get some direction with our stops at 112500. being executed. I have redone the longer term count that is now calling for higher to complete 5 waves up but with momentum not confirming , as yet an acceleration to the topside lets look to the short term to see how far along , what could be the final leg higher in 5 waves.
Medium Term Chart
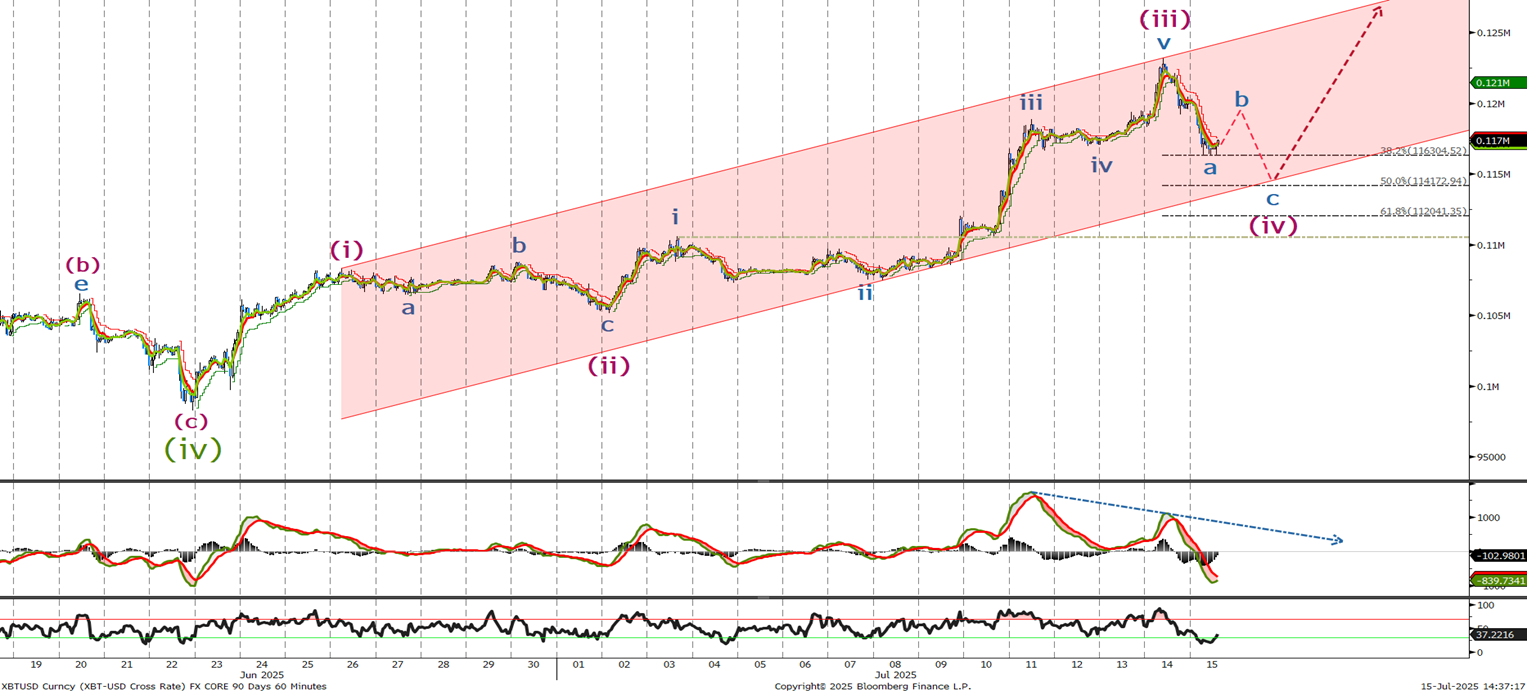
If we break down the rally over the last month I believe we have completed 3 waves of the 5 higher and are tracing out a wave (iv) correction that should take us down towards the bottom of the channel around 114k. In 3 waves. From there I would look to trade higher in 5 waves to new highs.
Bitcoin 30 Minutes Chart
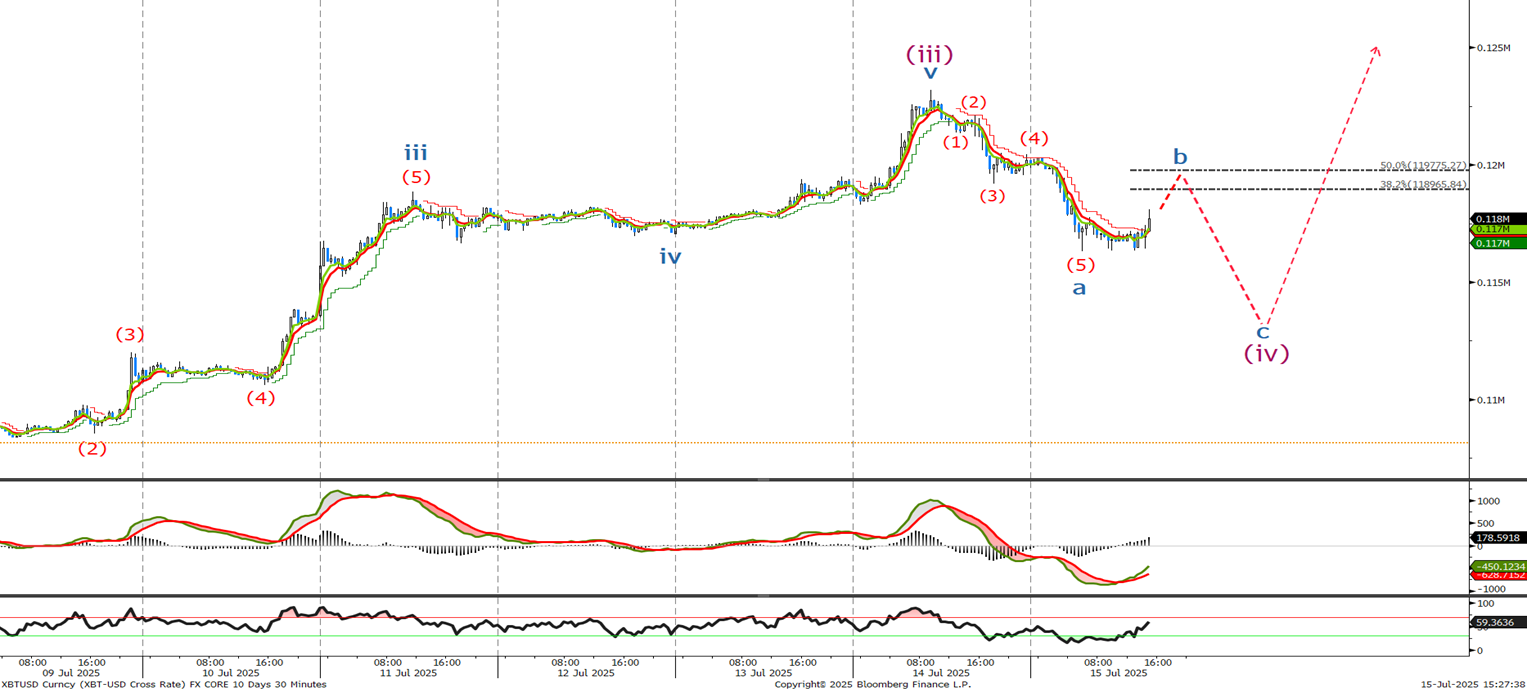
It looks in the very short term that we should trade slightly higher before another sell off to complete the minor wave (iv) correction. Look to add to longs there followed by 5 waves higher to new all time highs.